Just How Many Swing Voters Are There?

Geoffrey Skelley | September 19, 2019
It’s a long time until the 2020 general election, but there’s a good chance it will be competitive. After all, we live in a politically polarized era where most presidential elections are decided by relatively narrow margins (since 1988, in the single digits). Which means if the margins are as slim as they were in 2016, the race could come down to swing voters, or voters that tend to switch their support between the two major parties from year to year.
So we were curious: Just how many swing voters are there? A number of researchers have tried to tackle this question, and it turns out, there’s a pretty big range of answers.
That’s because defining who is and isn’t a swing voter isn’t easy, as it’s a small group. But estimates I previously made based on a couple of data sets suggest that there were around 10 million voters who shifted from voting for one major party in 2012 to the other in 2016, which accounted for roughly 7 percent of all votes cast. In the grand scheme of things, that’s not a lot of people, but these voters probably did play a role in helping President Trump get elected because around three-quarters of those voters swung toward him rather than Hillary Clinton.
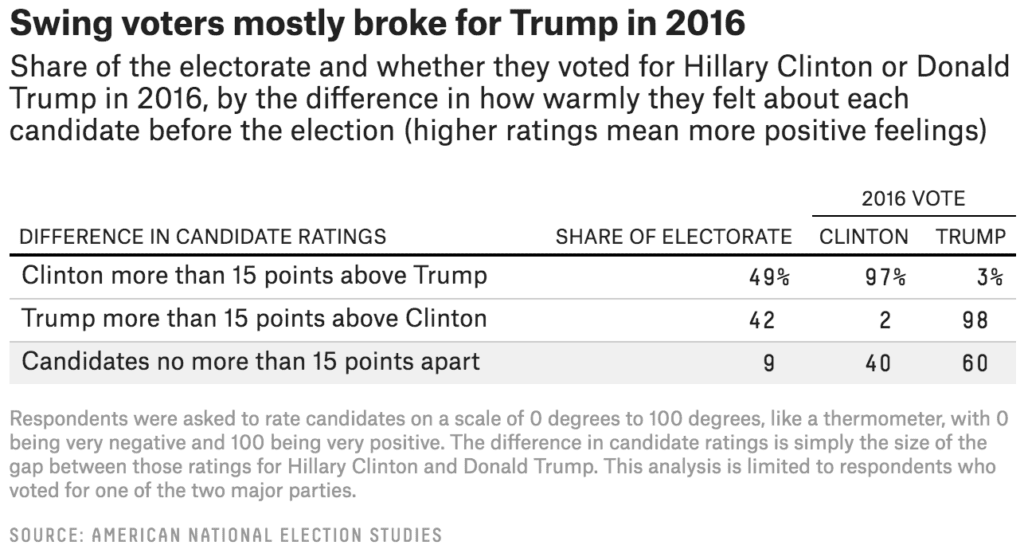
One way to get at this question is to use the approach of Northeastern University political scientist William Mayer, who wrote a 2008 book on the subject. To identify swing voters, Mayer used a set of questions from the American National Election Studies that asked respondents before the election to rate their feelings toward the candidates in terms of degrees (like a thermometer scale), with 0 being very negative and 100 being very positive. Mayer then looked at how respondents actually voted. Unsurprisingly, someone who rated the Republican 100 degrees better than the Democrat was basically certain to vote for the Republican, and vice versa. But Mayer also found that people who had similar feelings about both candidates were also the swingiest — the voters most likely to switch which party they supported typically rated the candidates no more than 15 degrees apart.
So if we apply Mayer’s methodology to the electorate in 2016, voters who rated Trump and Clinton within 15 degrees of each other in the ANES survey made up 9 percent of voters for the two major parties.1 To be clear, that doesn’t mean every one of these voters switched their support, but in Mayer’s view, this was the group of voters most open to persuasion by the campaigns. So even if there is evidence that the overall number of swing voters is declining, we’re still talking about at least a tenth of the electorate who might be willing to switch parties — and the fact that they broke for Trump in 2016 mattered.
However, some political scientists, like Corwin Smidt, who studies vote choice at Michigan State, argue that the percentage of swing voters is, in fact, much lower and in decline — he estimated just 6 percent of all Americans voted for a different party in 2016 than the one they backed in 2012. Smidt uses a much narrower definition of what a swing voter is — someone who consistently votes, but switches back and forth between the two major parties.2 In other words, he excludes people who only occasionally vote, even if they don’t identify strongly with one party.
But what if you include more casual voters? Could the number of swing voters in the U.S. be much higher? A new study from the Kaiser Family Foundation certainly seems to suggest that’s the case, classifying 30 percent of registered voters as swing voters. Why is KFF’s number so much higher than our estimates using Mayer’s or Smidt’s approach? For one thing, KFF is trying to account for people who might not always vote but could turn out if motivated. Part of the problem with understanding just how many swing voters exist is that many potential voters don’t consistently turn out. They may vote only once in a while (what Smidt calls “surge and decliners”) or they may not vote at all (what Smidt calls “repeat nonvoters.”) KFF tries to capture some of this in its polling — 24 percent of its swing voters didn’t vote in the 2016 election, or about 7 percent of their overall sample.3
However, the number of truly persuadable voters is probably much smaller than the 30 percent top-line number in KFF’s report — just 16 percent of all voters told KFF either that they were undecided or that there was “a chance” they might vote for the other party’s candidate. As for the other 14 percent of respondents who were classified as swing voters, they said they were probably going to vote for one party and would not vote for the other side — but they also said they might not vote, period. This suggests that many off-and-on voters aren’t actually that “swingy” in their voting preferences. In his research, Smidt found that rates of swing voting among these more intermittent voters had also declined, telling FiveThirtyEight that, “Polarization makes party differences so clear to even non-voters or sporadic voters that the potential swing they could provide in an election is shrinking.”
So while not all 30 percent of the registered voters who KFF grouped into its “swing voters” category are actually open to being convinced by a good campaign, its polling does suggest that if turnout increases in 2020, there could be more swing voters than in 2016, since some of them spent the last presidential election cycle on the sidelines. As for who these voters might swing toward, KFF found that, on average, these voters were younger, less partisan and more moderate than voters who have already made up their minds. Additionally, they’re less politically engaged, with about one-third saying it “doesn’t matter” or “somewhat matters” who wins in 2020. This is in stark contrast to the more than 90 percent of decided voters who said that it “really matters” who wins. Notably, KFF’s data also found that swing voters were slightly more likely to identify as Republican or Republican-leaning than Democratic or Democratic-leaning, which is different from people who are not registered to vote, who tend to lean Democratic. (People who aren’t registered to vote also tend to be young, but are more likely to be nonwhite than KFF’s swing voters.) Still, Trump’s net approval rating among these voters was negative — 44 percent approved of his job performance compared to 53 percent who disapproved — so it’s not entirely clear which way the bulk of these voters might swing.
And of course, it is the Electoral College that decides presidential elections, not the popular vote, so where swing voters are based geographically can have huge electoral consequences. Catalist, a Democratic data firm, recently found that the shifts in vote margin from 2012 to 2016 in many swing states were predominantly driven by changes in vote choice rather than changes in turnout. According to their analysis, the change in vote margin in the three key states of Michigan, Pennsylvania and Wisconsin could mostly be explained by people shifting which party they voted for, rather than by changes in turnout. On the other hand, using data from the 2016 Cooperative Congressional Election Study, a large nationwide survey that focuses on respondents’ political attitudes, other researchers have suggested that depressed voter turnout or votes for third-party candidates could also explain a big part of the national swing toward the GOP. So while estimating the number of swing voters is challenging — and the number will vary depending on what data and definitions you use — the importance of swing voters should not be understated. How they swing in 2020 could make all the difference.
Geoffrey Skelley is an elections analyst at FiveThirtyEight.