Please note: The analysis below is based on an initial estimate of the 2018 electorate. Catalist released an updated analysis of the 2018 electorate in May 2019.
December 20, 2018
Author: Bennett Hillenbrand, Catalist Analytics
Immediately after the Clinton-Kaine campaign’s defeat in 2016, all eyes turned to Virginia’s 2017 off-year elections as an early harbinger of what was to come in the new era of Trump. Encouraging results at the statewide level, as well as significant gains in the House of Delegates (even though control remained in Republicans’ hands) gave many progressives hope (rightly so!). Catalist’s post election analysis of vote share and vote choice, while highlighting where public exit polls were too optimistic to be accurate, illustrated favorable movement in that the off-year electorate was more racially diverse and younger, and that Democrats had received higher support among white non-college voters than in prior, comparable, elections.
Fast forward to 2018, and Kaine’s reelection to the US Senate in this still-purple state was never really close, with estimates from pollsters and pundits eventually converging on a predicted outcome of “Safe D” early in the election cycle.1Throughout this analysis, we’ll reference Kaine’s performance across Virginia. In the near future, we will add to this dataset estimates for VA-10, which was also included in this project. Kaine made good on that prediction, beating Republican challenger Corey Stewart by a margin of 16 points. Beyond statewide success in 2018, down-ballot Democrats flipped 3-out-of-4 targeted Red to Blue congressional districts (VA-02, VA-07, and VA-10, with VA-05 being the only near miss).
Kaine’s reelection, combined with additional Democratic victories across the state in 2018, illustrate three important dynamics about the current state of play in Virginia:
- Demographics have been moving the state from purple to blue
- Improvements in support among suburban voters have accelerated this movement — statewide and at the congressional level
- And the potential to establish progressive inroads with historically challenging groups such as rural voters and whites without a college degree.
Towards a Blue Virginia
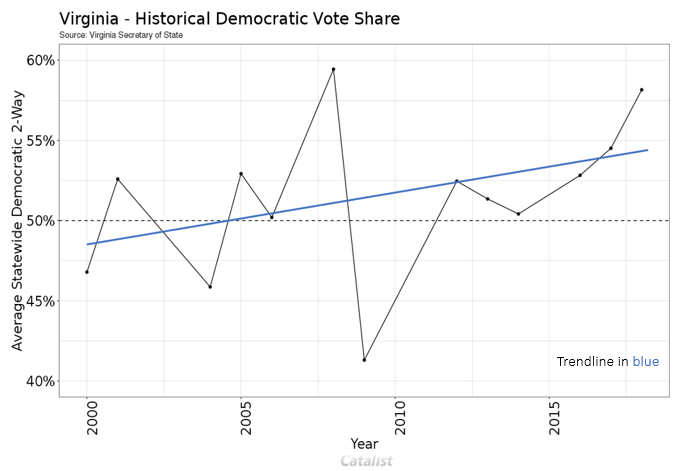
Starting with the Democratic 2-way share for statewide elections, we see a clear trend in vote choice since the 2000 presidential election towards Democratic candidates in Virginia, albeit with outliers in 2008 and 2009:
But what could be driving this movement?
As we have already noted in our National and Georgia analyses, the 2018 electorate was younger and more diverse than previous midterm electorates. It was also more educated than any election we have individual level data for at Catalist (going back through 2006).
This increase in diversity has been mirrored in Virginia over that same time period. The last Democratic midterm wave year was 2006, and in the 12 years since that election, the Latinx share of the electorate rose by 3 percentage points, Asian American share of the electorate went up 3 points, and African American share grew by 4 points. These increases among Communities of Color are accompanied by corresponding decreases in the white share of the electorate — similar to what was seen in 2017 as well.
Latinx and Asian American voters in Virginia also started supporting Democratic candidates at much higher rates over that same time period (though relatively small sample sizes mean there may be more noise in the estimates). The Asian American and Latinx populations in Virginia also continue to grow, so as long as support remains stable, Democratic gains will continue to accrue over time. That stability in support is, of course, not guaranteed.
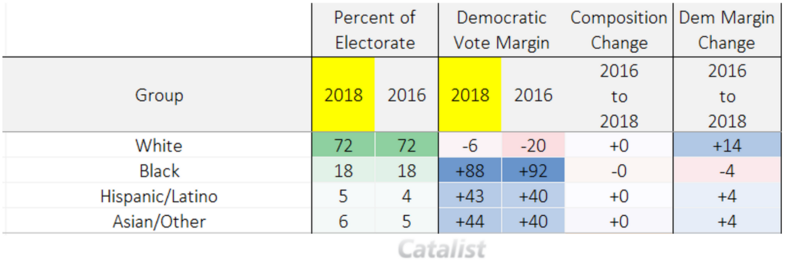
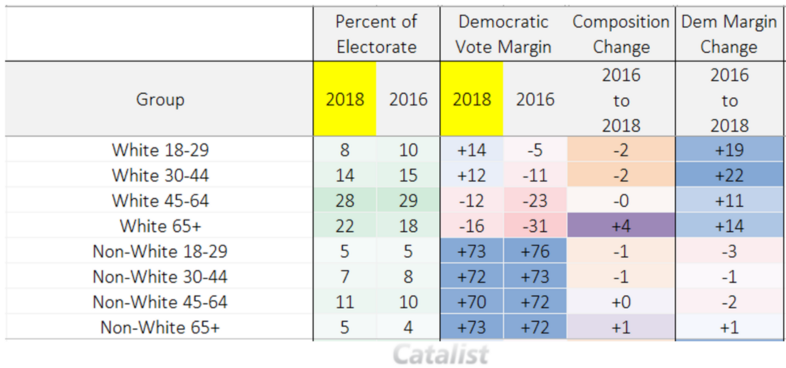
As shown in the chart above, we also see that Kaine picked up 14 points of support among white voters compared to Clinton’s level of support in 2016 (important given that whites accounted for nearly three-quarters of all votes cast in 2018). Digging deeper into that change among whites by age group, there is roughly a 20 point swing in support among the 18–29 age group and 30–44 age group:
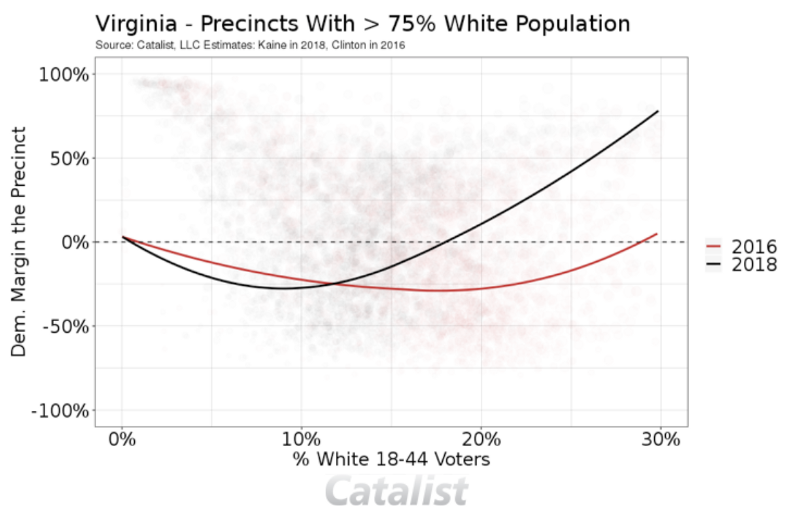
This increase in support among younger white voters is plainly visible at the precinct level as well. The graph below shows the relationship between the percent of the white population under 45 and Democratic vote share. This graph only includes precincts where the population is at least 75% white, to help show this relationship more strongly. In short, precincts where a larger share of the population is white and young demonstrated the greatest degree of improvement for Kaine over Clinton.
Is the Density of Congressional Districts Destiny?
The results in Virginia’s congressional districts look a bit different than what happened nationally, with respect to population density. As we covered in our national Congressional analysis shortly after the election, the largest Democratic gains came in rural districts, whereas in Virginia, the largest gains came in the suburbs.
In Virginia, Republican voters in rural districts remained largely unmoved, but middle partisanship voters swung strongly towards Democratic candidates in rural and suburban districts.2Since 2010 redistricting, Virginia has had 3 different sets of congressional district lines, impacting CDs 1, 3, 4, and 7, so historical comparisons for these four districts are a bit fraught but are still included for completeness. Again, the trend is somewhat unique to Virginia and not necessarily what happened across the country. Citylab has put together a useful categorization of congressional districts by geographic density, and FiveThirtyEight very recently published an analysis of 2018 congressional district partisan shifts, which included an informative section based on the Citylab categorizations.
The table below shows the relationship between the density of a given district (from most to least dense, using the Citylab classifications) and the 2016 and 2018 election results:3VA-11 and VA-03 were uncontested in 2018, so no 2018 margin or shift in Democratic margin between 2018 and 2016 is calculated.
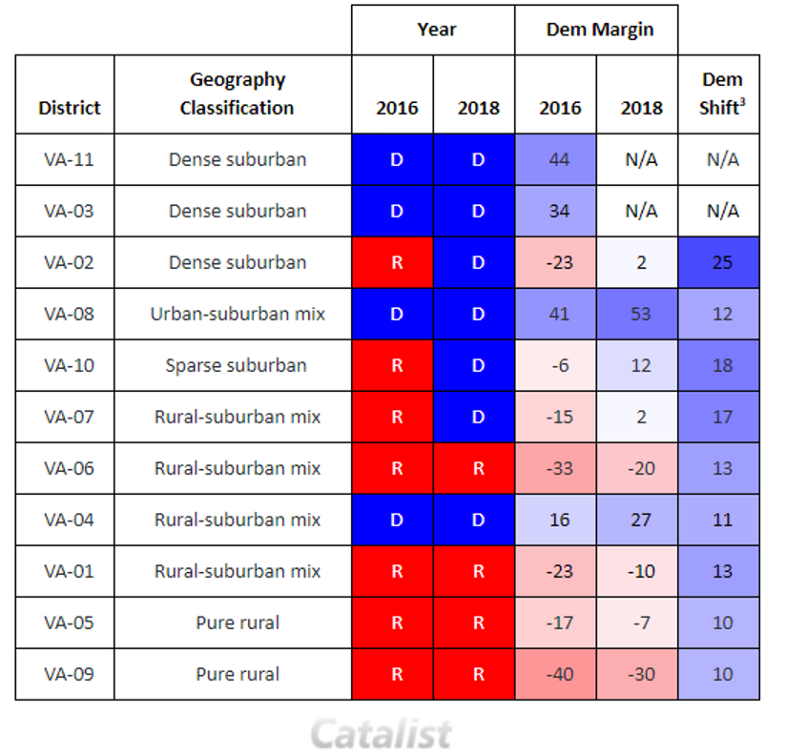
As was the case nationally, the Democratic seat pickups came from the suburbs, despite the Democrats picking up more votes in the predominantly rural districts. This is because they started from a deficit that was typically too large to overcome (due to factors like gerrymandering and incumbency) and those seats remained almost exclusively Republican.
Interestingly, within rural congressional districts, support for Kaine was up compared to Clinton in the higher density areas of those rural districts, but essentially unchanged in the most rural parts of the state. The graph below shows this relationship across Virginia’s eleven congressional districts; in less dense areas of each state 2016 and 2018 performance more closely mirror each other, but the two diverge as community density increases.
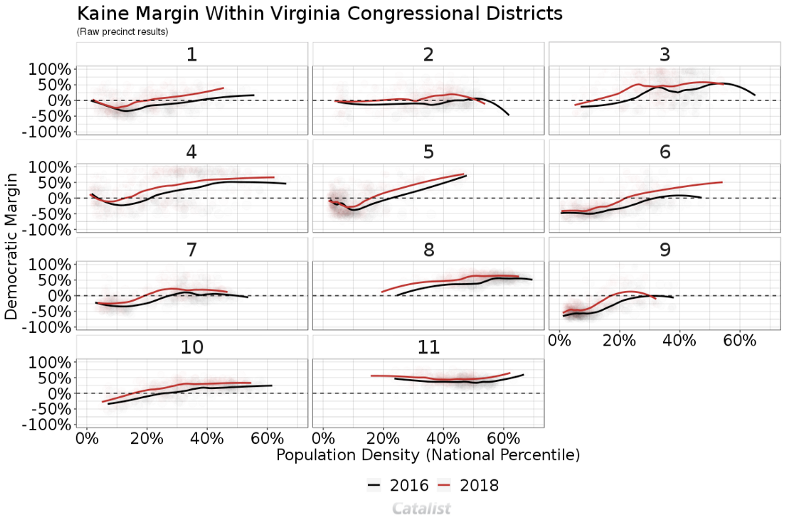
This raises an interesting question about where the rural district gains are actually coming from — the answer might not be from the purely rural areas, but rather from the small towns and bedroom communities outside of the suburbs.
Almost assuredly this is connected with the education level and historical partisan preferences within these communities as well.
Progressive inroads with non-college white voters and rural communities
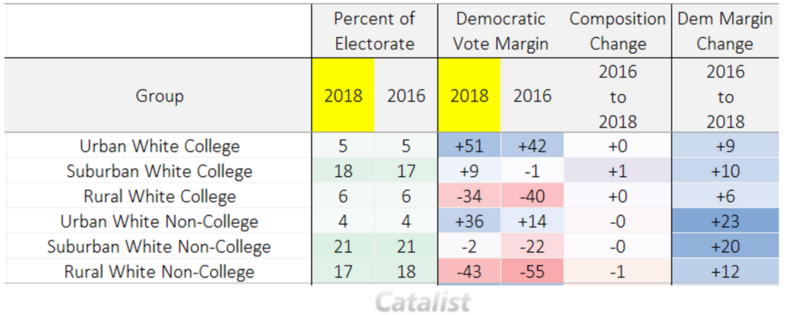
Kaine performed 17 points better than Clinton among white non-college voters, a group that accounted for 42 percent of the Virginia electorate in 2018. The gains were slightly higher among white non-college women (+19 points vs. 2016) than men (+15 points vs. 2016), but strong among both groups. Notably, Kaine was able to build support among non-college white voters while at the same time stretching his margin among those with college degrees (+9 vs. 2016).
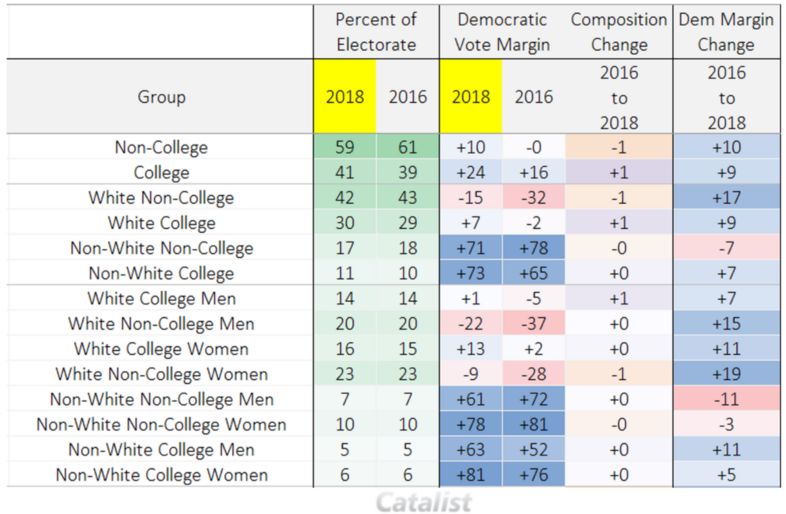
Importantly, these shifts in support from white voters are not Republicans defecting from their party. Instead, this was movement among middle partisans — a group that grew in size compared to past cycles and supported Kaine at a rate 20 points higher than Clinton. Given their 38 percent vote share in Virginia, this equates to a net topline change of +8 points.

Lastly, beyond the general shifts by population density mentioned earlier, it is notable that Kaine outperformed Clinton among non-college voters in urban, suburban, and rural communities alike. Though the gain was (expectedly) highest among urban voters, rural white non-college voters shifted towards Kaine by a 12 point margin, which is significant given the challenge this group has presented historically, as well as the fact that they account for 17 percent of the electorate.
