Please note: The analysis below is based on an initial estimate of the 2018 electorate. Catalist released an updated analysis of the 2018 electorate in May 2019.
February 15, 2019
Author: Bennett Hillenbrand, Catalist Analytics
Between 2008 and 2016, Virginia’s 10th Congressional District supported the Democratic candidate in 2-out-of-3 presidential elections and the Republican candidate in all 5 congressional elections. While longtime Republican incumbent Frank Wolf was certainly a force, his successor Barbara Comstock proved formidable in countering the swingy, if not Democratic-leaning nature of the district, in both 2014 and 2016. The clear presence of ticket-splitting voters, the overall demographics of the district, and the general trend towards a bluer Virginia made this district an obvious target for the DCCC Red-to-Blue program once again in 2018. Confidence in flipping this district was buoyed by the recruitment of a strong candidate in former State Senator Jennifer Wexton. This confidence was justified, as Wexton went on to defeat Comstock by 12.5 percentage points — or 46,000 votes — in the 2018 congressional election.
This 12.5 percentage point margin essentially matched Governor Northam’s performance in this district, was slightly higher than Clinton’s 10 point victory in the district in 2016, and a full 10 points better than Obama’s performance in the district in 2008. The national Democratic margin in all congressional races went from -1 in 2016 to +9 in 2018, an impressive 10 point swing. At the same time, Wexton’s success reflected a full 20 percentage point swing from Comstock’s performance in 2016, certainly an impressive result, and an overperformance even relative to the 16 point victory posted by Tim Kaine as discussed in our Virginia Senate analysis.
Wexton’s resounding victory leads us to ask two particularly important questions: 1) does her performance represent a Democratic high water mark in this historically competitive district and 2) which voters was she able to win that statewide candidates in the past may not have? To answer those questions let’s start by examining the factors that created such a wide margin of victory:
- The partisan composition of the 2018 electorate in this district did not look like previous midterm electorates. Historically, the Republican share of the electorate in 2014 and 2010 was at or above 40%, but fell to 29% in 2018. Interestingly, Historical Democratic share is unchanged between 2010, 2014, and 2018. This loss in Historical Republican share was offset entirely by a corresponding increase in Historical Middle share.
- The 2018 electorate matched the most diverse electorate ever in this district. Voters of color made up 27% of the total vote, the same as in 2016, but a full 7 percentage points higher than 2014.
- Wexton received unprecedented levels of support among white Gen X and Gen Y voters. Wexton’s margin of support among white 30–44 year olds was +17 percentage points. The previous high water mark for this demographic group was +1 for Clinton in 2016. Even Obama did not carry this group (he received 48% of their vote in 2008).
- Wexton’s margin among college-educated voters was +20 percentage points, a full 5 points ahead of Clinton. College educated voters make up over 50% of this district, making it the 12th best educated district in the country. So in an environment where educated voters seem to be defecting from voting Republican, an improvement of this magnitude in a district with this educated a population produces large shifts in topline margins.
Was 2018 a high water mark in the 10th district, or what would Wexton need to maintain in order to recreate her success?
As mentioned above, this topic must begin with an analysis of the composition of the electorate in 2018. This electorate had a higher share of Middle Partisans, and matched or exceeded the vote share among voters of color compared to all previous elections that Catalist has data for:

The 45 percent vote share of Modeled Historical Middle voters in this election is a full 12 percentage points higher than any previous midterm going back through 2006. For a variety of reasons we don’t refer to these voters as “independents”, however, it is fair to say that there are more swing voters in this category than in the Historical Republican or Historical Democrat buckets. In the current political environment, these voters moved strongly in the direction of Democratic candidates (+ 12 percentage points) nationally between 2016 and 2018, whereas that same group of voters moved towards Democrats in VA-10 between 2014 and 2016 by +25 points.
Maintaining this level of support among the Modeled Historical Middle is critical for Wexton’s re-election prospects, especially since this group appears as volatile, if not more so, than Historical Middle voters nationwide.
That said, there may be a few more votes available to Democrats in this district by recreating Obama’s crossover appeal in the more rural, western part of the district.
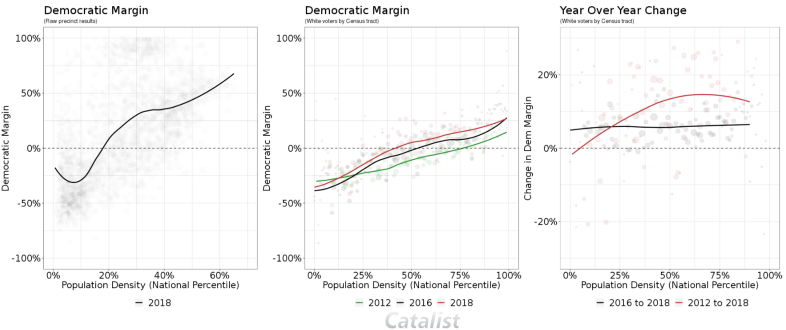
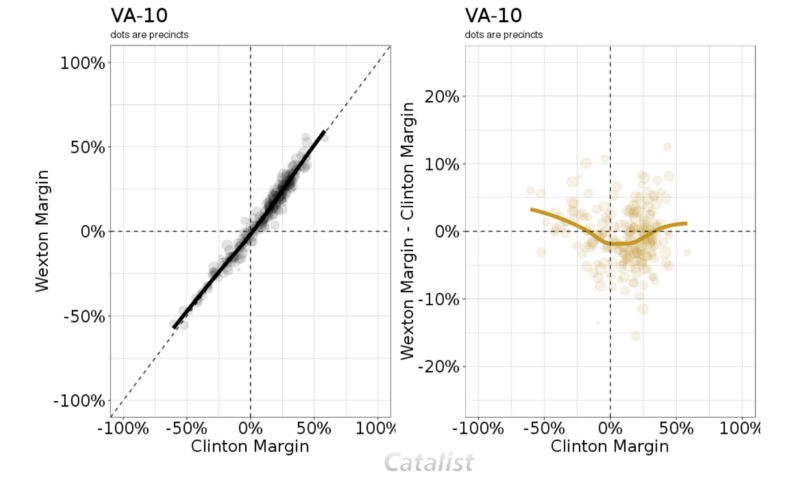
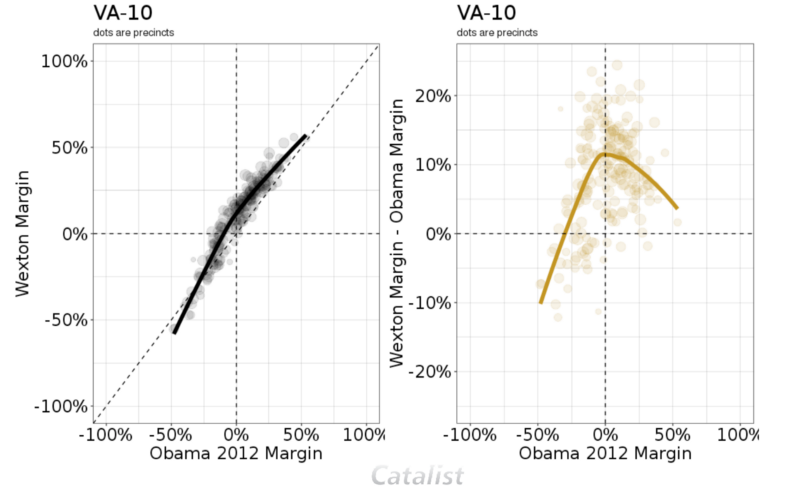
While a majority of the district is made up of voters in the DC suburbs, about 30% of the vote tends to come from the rural western part of the district. Looking at the graphs below, where the x axis represents the population density of a precinct in the district, the middle graph shows us that Wexton’s 2018 red trend line dips below Obama’s 2012 green trend line from about the 25th percentile and below. The graph on the right paints a slightly clearer picture, where we see Wexton’s performance across geography to be highly correlated with Clinton’s, but at a uniformly higher level, whereas performance compared to Obama has a strong relationship to geographic population density. Put simply: there are definitely rural voters in this district who pulled the lever for Obama in 2012 and Comstock in 2018.

Looking ahead, two potential paths appear possible. As Virginia, on the whole, grows increasingly diverse every year, and voters of color have consistently supported Democratic candidates, there is the potential for the district to remain, if not become increasingly Democratic. Similarly, the district may continue to become increasingly suburban, with the rural share of the vote subsequently declining over time.
How did Wexton do compared to previous statewide candidates?
To answer this question, it is useful to look at 2018 margin compared to 2016 and 2012 margins by precinct. Essentially, in places Clinton and Obama did either well or poorly, how did Wexton fair? The answer is something of a mixed bag:


In places where Clinton did well, Wexton did somewhat better, whereas in places Clinton split 50/50 with Trump, Wexton actually did somewhat worse. This is the exact opposite of what we see in the Obama margin comparison — in places Obama split 50/50 with Romney, Wexton improved by 12 percentage points. This aligns nicely with her performance increase we saw among Historical Middle partisans and what we show below with respect to performance in the urban and suburban regions of the district when compared to Obama:

Something not yet mentioned in this analysis: VA-10 is the wealthiest district in the country as measured by median income. As we did not include an income breakout in our model-based estimates (see the original post from this series for a full description of the methodology), we can’t say too much about this yet, but it will be interesting to see if wealthier voters in VA-10 behave similarly or as an outlier compared to other wealthy voters. In the interim, we do have data for education levels, which can serve as a meaningful proxy in this district. As mentioned, the district is over 50% college educated, and among that group we do see an improvement, even over Clinton, especially among white college-educated voters (this improvement among educated voters obviously has a strong overlap with the geographic density improvement):

Finally, Wexton outperformed all previous candidates with respect to white Gen X and Gen Y voters in this district by a margin of over 16 points:

Even if this does represent something of a high water mark, if that cohort of age 30–44 white voters solidifies around Democratic candidates going forward, this district could move from the toss-up column into the Democratic column for years to come.

