Interactive Dashboards
Catalist's Voter Registration and Absentee and Early Vote (AVEV) data visualizations allow clients and partners to analyze registration and voting nationally, by state and county, over time, and across several demographic and behavioral categories.
These reports are automatically updated as clients add new voter registration applications and states update their official voter files. Clients can monitor applications nationally or by state, examine activity among partner organizations, and compare their efforts to other voter registration and mobilization efforts.
Catalist’s data visualization projects are built with interactive, customizable Tableau dashboards. Our clients and partners use Tableau for in-depth programmatic reports, analysis, and reporting on everything from message development to comparing geographies for resource distribution.
Catalist released five dashboards during the 2020 election cycle:
Voter File Intelligence Report
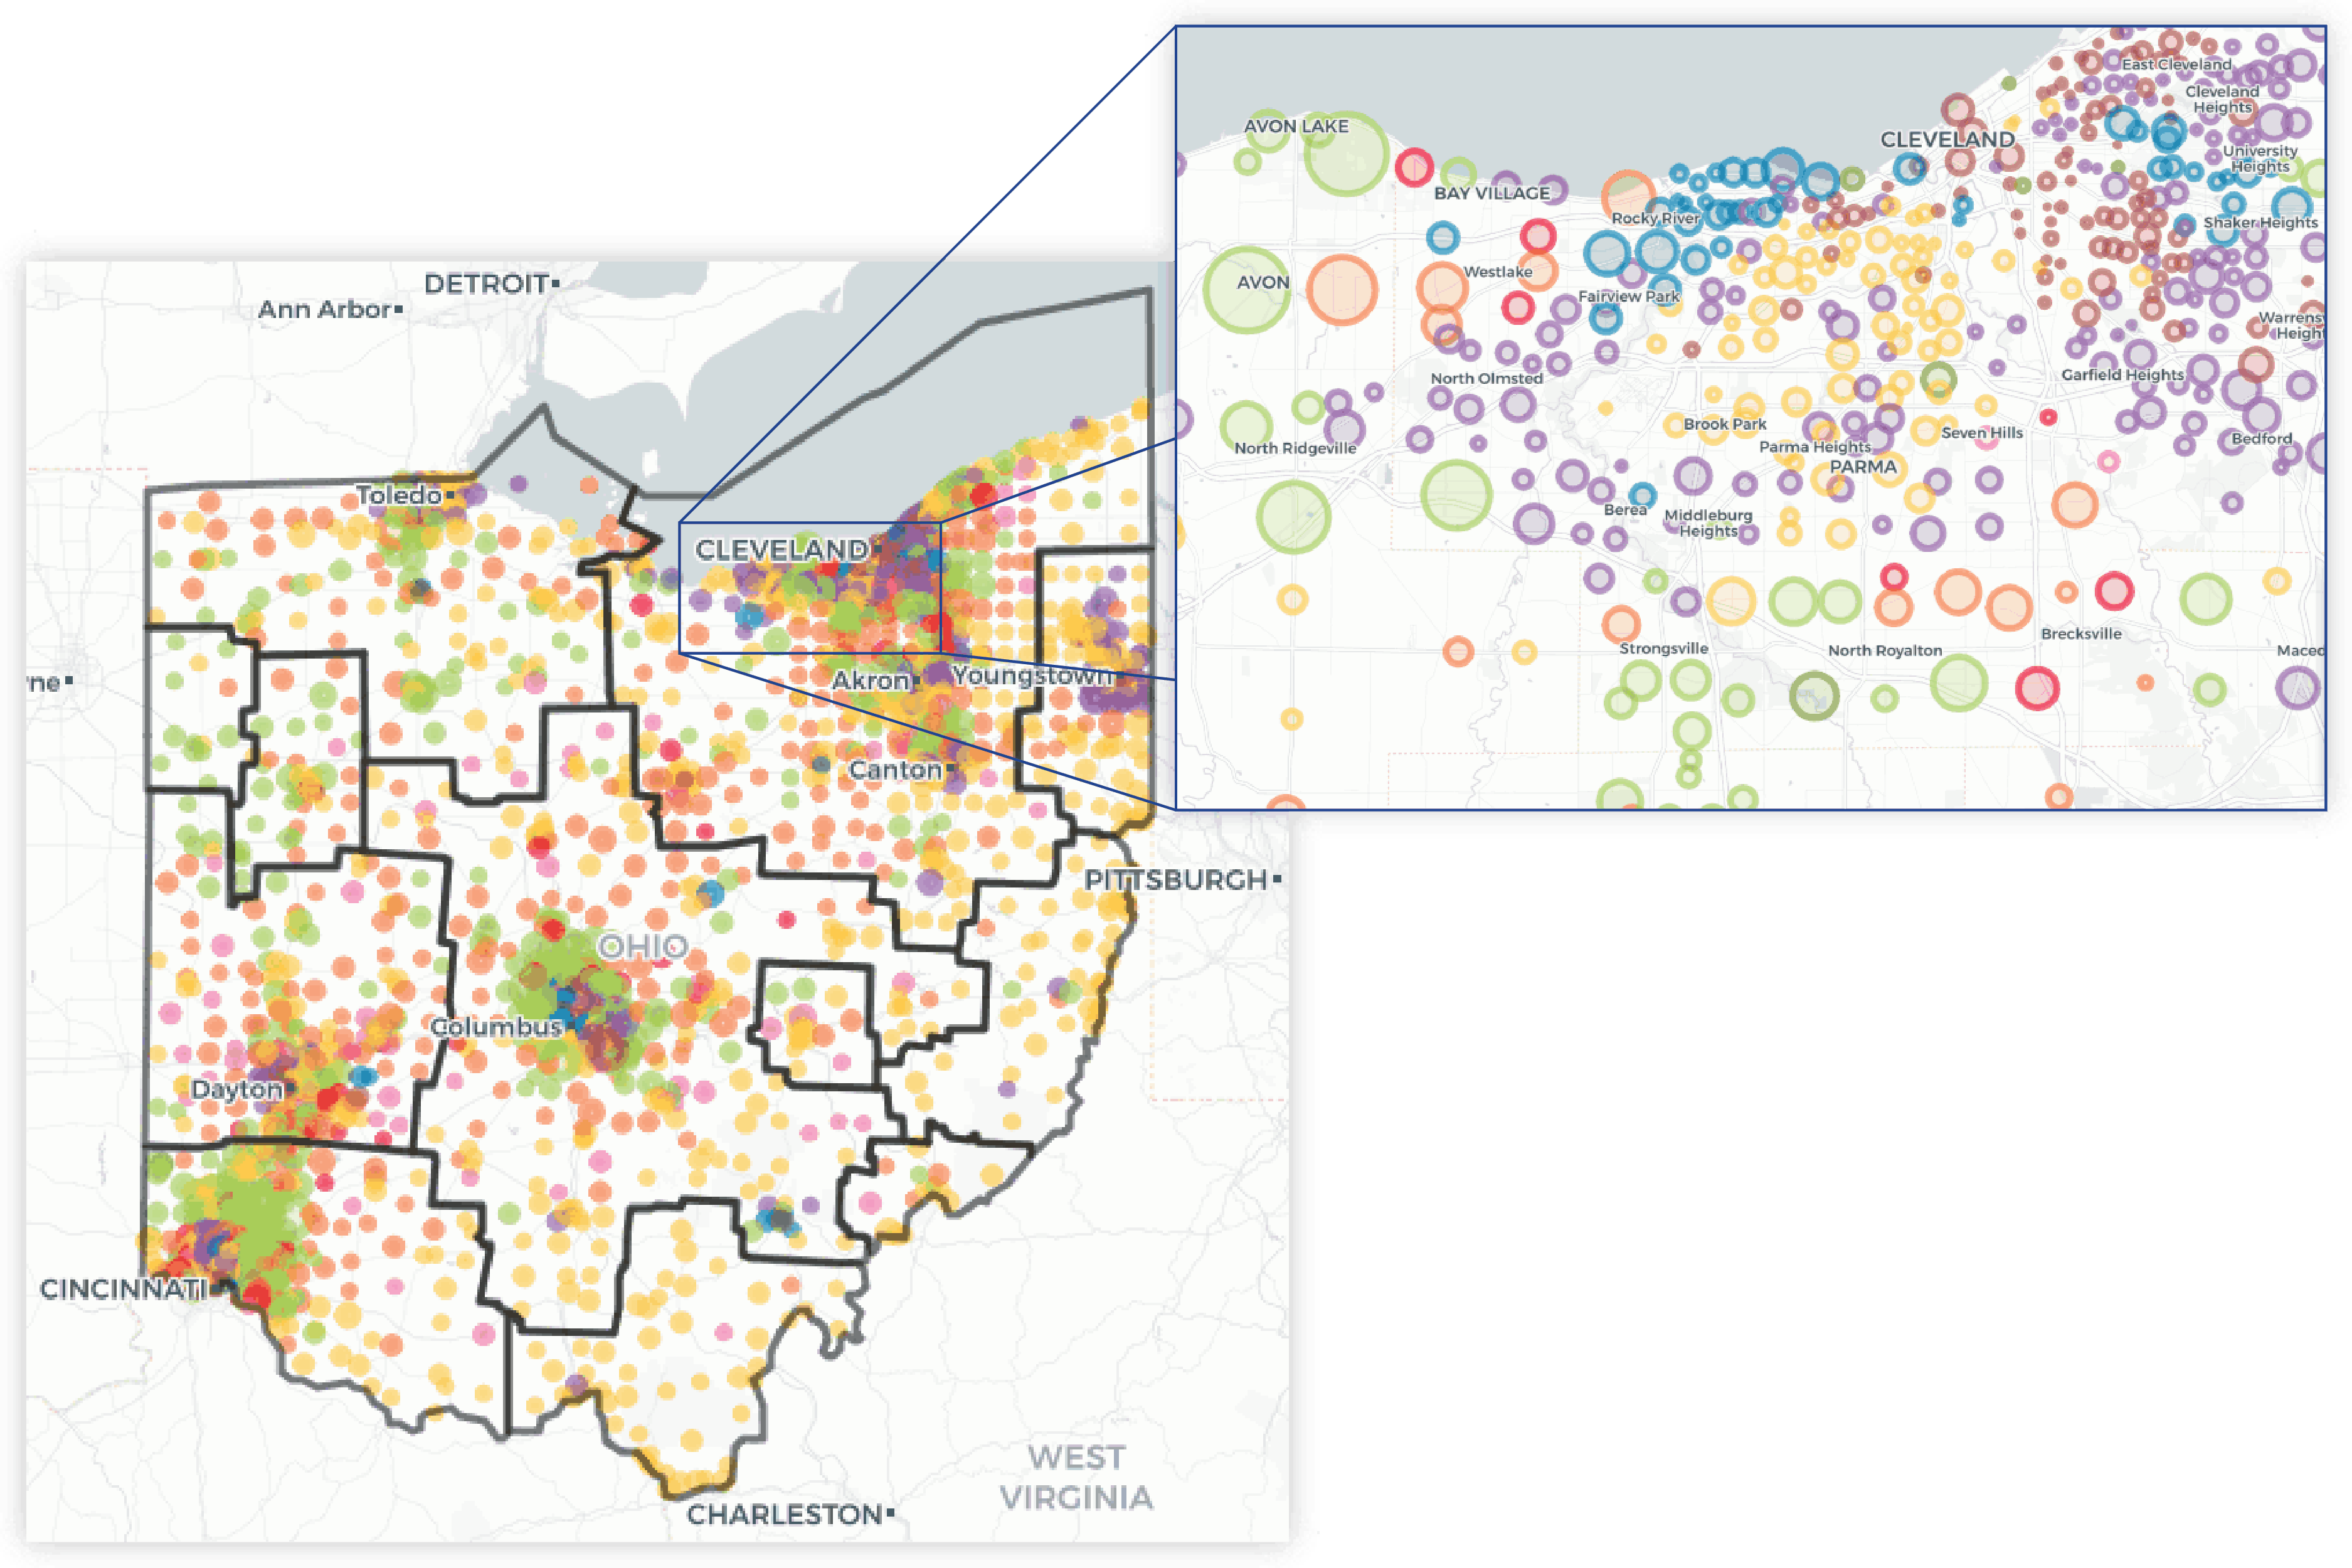
The Voter File Intelligence Report (VFIR) is a dashboard that shows topline information on new registrants, newly inactive voters, and dropped records by state, along with comparative historical context. This tool provides intelligence on state- and precinct-level voter registration changes, particularly in identifying anomalies in new registrants and purged records.
2020 AVEV Dashboard
Catalist’s AVEV Report is an interactive dashboard that tracks Absentee and Early voting in the 2020 General Election in all states where Catalist can collect data from official sources. The dashboard offers analysis based on demographic data and political behavior models.
Georgia Runoff Dashboard
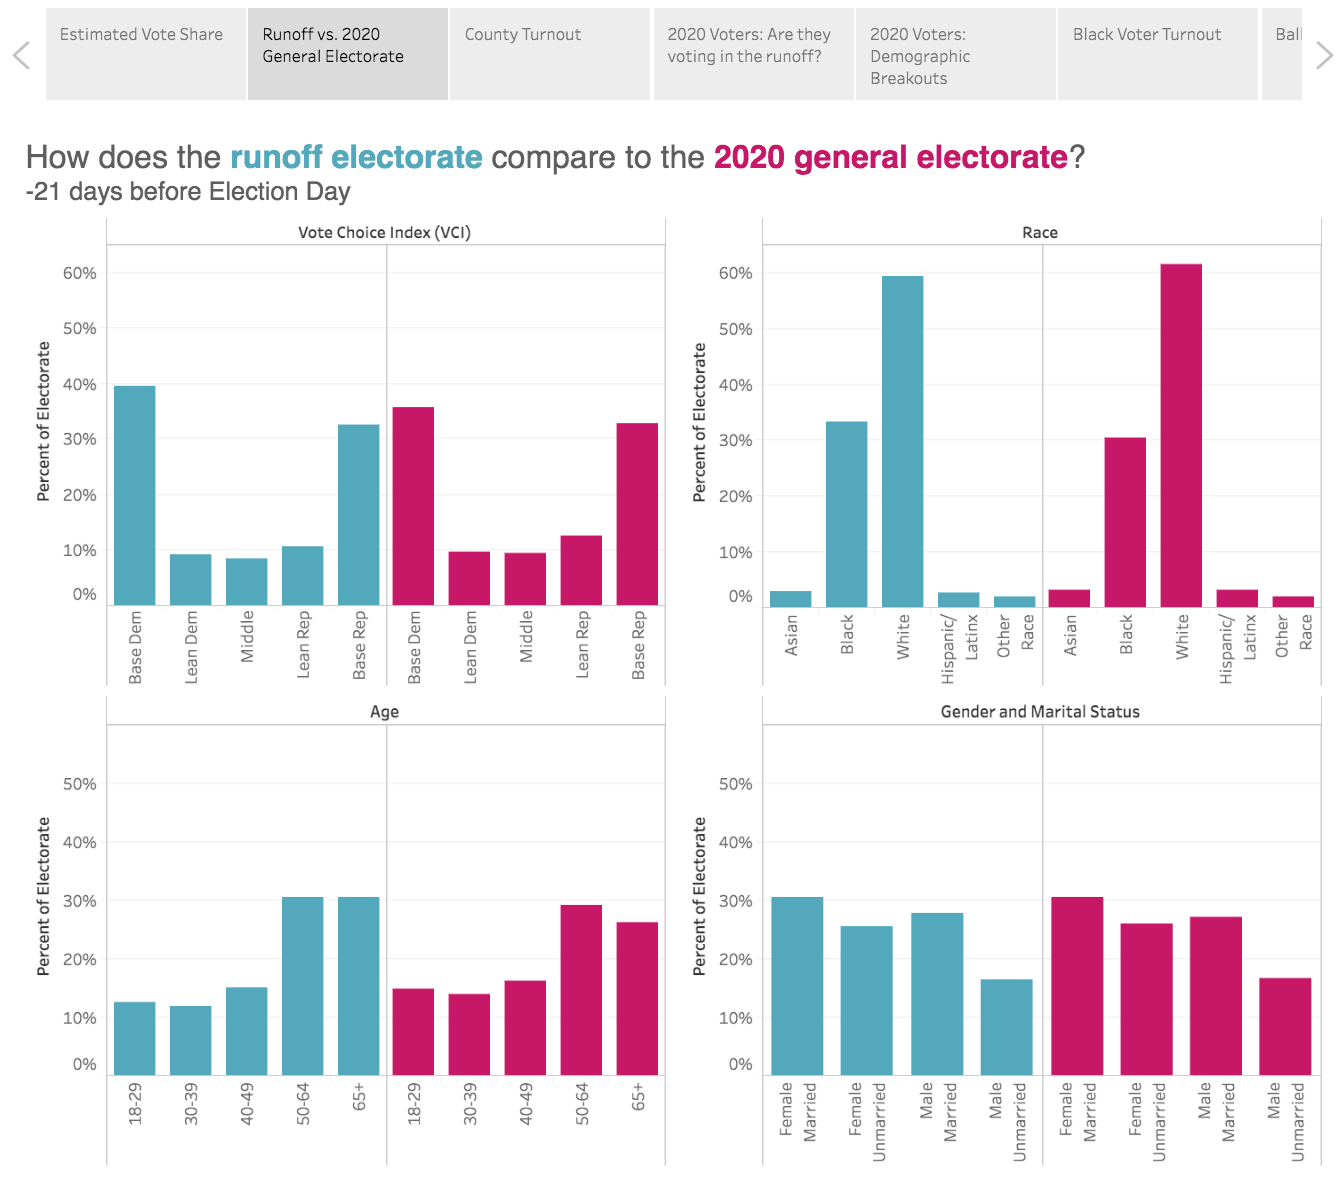
Catalist’s Georgia Runoff AVEV Report tracks Absentee and Early voting in the January 2021 runoff election. The report offers visualizations based on demographic data and political behavior models. Users can compare request data and early returns with comparable dates in the 2020 General Election, as well as see breakdowns by race, age, gender and marital status, vote choice and vote history. We are also tracking rejected ballots by county, where data are available.

Voter Registration Report
Catalist's Voter Registration Applicant Report is an interactive dashboard that allows users who have submitted applicant data through Catalist to track and explore granular data on new registrations, registration confirmations, address changes, and pending applications.
First Time Voter Registrant Report
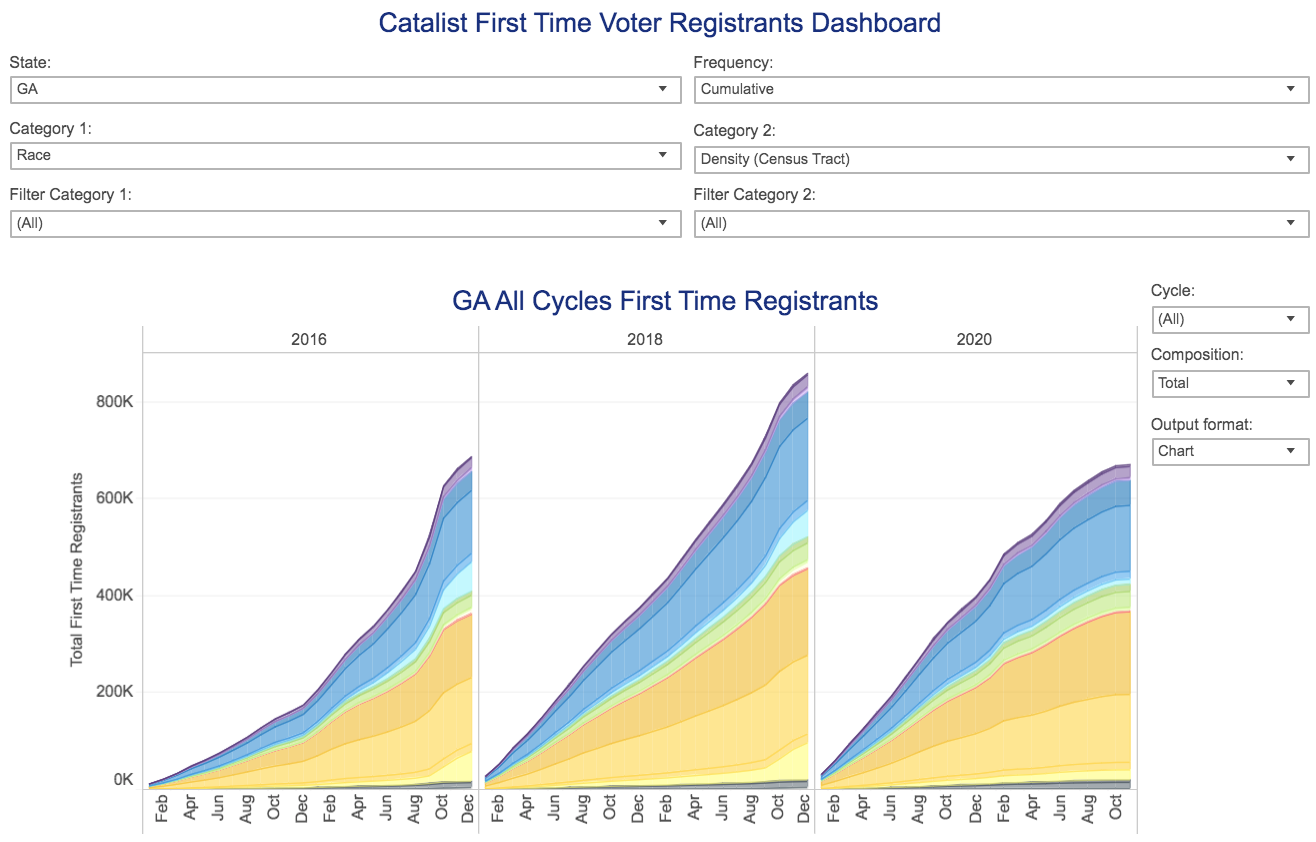
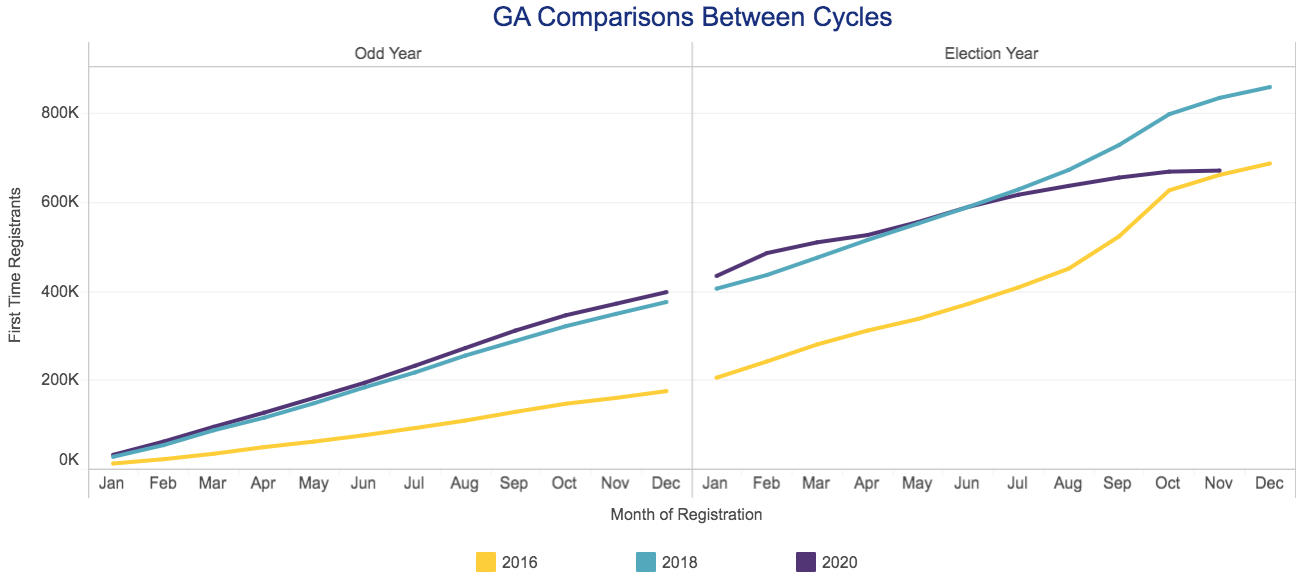
Catalist's First Time Voter Registrant Report is an interactive dashboard that tracks voters who have specifically appeared for the first time on their state voter registration file. The dashboard offers breakdowns based on demographic data and political behavior models in all 50 states.


CUSTOM RESEARCH & ANALYSIS
The Catalist Data & Analytics teams offer a broad menu of research and strategic products for organizations of all sizes and types.
Commissioned research projects from previous cycles include:
- Member voting analysis
- Battleground strategic analysis
- Precinct-level District demographic reports
- Membership acquisition and mobilization reports
- Vote Choice History and Demographic composition custom crosstabs
- Voter mobilization among underserved demographics groups in battleground states
- Messaging and values-based persuasion analyses for membership mobilization


