By Yair Ghitza and Jonathan Robinson
Edited by Aaron Huertas, Site design by Melissa Amarawardana
This report would not have been possible without the dedication of many on the Catalist team, whose hard work maintaining this national database is paramount to our ability to produce this report. The authors would also like to thank Meg Schwenzfeier, Hillary Anderson, and Molly Chapman Norton for their feedback and assistance in putting together this memo and the Catalist Data and Analytics departments for the foundational work they do supporting this effort.1We would like to particularly thank Justine D'Elia-Kueper, Maggie Dart-Padover, Sarah Grant, Alan Julson, Jesse Zlotoff, Matt Zetkulic, Anna Baringer, Russ Rampersad, Dan Buttrey, Jordan Tessler, Mary Toole, and John Kim in particular for their many important contributions to this project. We’d also like to thank Scott Anderson and Carly Hawkins with the Strategic Victory Fund and Brian Stryker and Megan Crowe from Impact Research for their contributions to this analysis.
A preliminary version of this memo was originally written and circulated immediately after the 2021 election in Virginia; at that time, we used turnout projections based on a pre-election turnout model, early voting data, and precinct-level election results. Now that we have received individual-level vote history data from the Virginia Secretary of State, we are updating the graphs and numbers in the memo to reflect the actual vote history. None of the major or minor conclusions from the original memo have changed.
Election night was largely disappointing for Democrats. Despite historic developments since 2016, including record-shattering turnout in 2020, an ongoing pandemic, and a violent right wing attack on the U.S. Capitol, the 2021 elections were largely consistent with previous years in which voters are more likely to cast ballots against the president’s party.
This memo details our understanding of the election, based on election returns, vote history, polling, and the historical context. We will mostly focus on Virginia, but we think it’s reasonable to assume that these points are broadly applicable given the swing against Democrats we saw in other areas.
Our top-level takeaways are:

The national environment for Democrats is fragile and is exerting the most influence on election outcomes.
There has been much discussion about the details of the Virginia race, but it is clear that much about the election result can be explained by national trends, especially when we compare Virginia’s results to New Jersey’s, which also held a less competitive statewide election. Although there are exceptions to these trends in U.S. history, based on external events and campaign dynamics, odd-year and midterm losses are the norm after one party wins a federal trifecta, and is a worrying sign for Democrats heading into 2022.

While turnout as a whole was high in Virginia, Republican turnout was even higher.
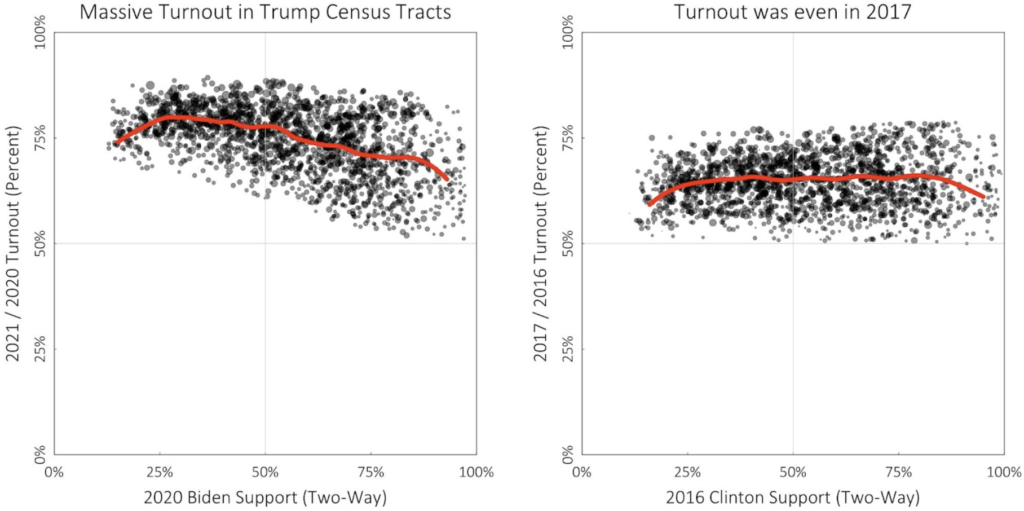
Turnout in Democratic areas matched their relative rates from 2017: about 60-70% of the previous presidential election. But in Republican areas, turnout was at 75-80% of 2020 levels, even though 2020 turnout was at an all-time high itself. The demographics show a similar story, with Republican-leaning groups out-voting Democratic-leaning groups.

Turnout varied significantly by age.
Youth voting usually sees a significant drop-off from presidential to odd-year elections. This was true in Virginia, but this drop-off occurred from a significantly higher baseline thanks to record-breaking youth turnout in 2020. At the same time, older cohorts showed less drop-off for an odd year election, as we’d expect. A particularly large cohort of older voters, the first Baby Boomers, are starting to pass away, aging out of the electorate. As a result, this was the first odd-year election in Virginia where Gen X, Millennial and Gen Z voters comprised a majority of the electorate. Examining age by birth year and cohort is especially important as relatively large cohorts of voters age in and out of age ranges we often use to define “youth” voting and older cohorts.

Our estimates show a fairly even decline in support across Virginia voters, with some exceptions.
As is often the case, we see the largest drop among “middle scorers” in our Vote Choice Index model and “swing neighborhoods.”2Our Vote Choice Index model projects the likelihood that a voter will cast a ballot for a Democratic candidate in a typical two-party race. A score of 100 is a high likelihood of voting Democratic while a score of 0 is a high likelihood of voting Republican. Middle scores tend to include more independents, swing voters and voters for whom models do not have robust projections. These are groups and areas that have not shown evidence of being particularly partisan in the past. We see a larger drop in support for McAuliffe (compared to Biden) in the suburbs and a larger drop among young people, both of which are due to a combination of turnout changes (Democrats staying home) and vote switching (Biden-Youngkin voters). The 2021 shift is close to the mirror opposite of trends we saw in Tim Kaine’s 2018 U.S. Senate victory, a similarly partisan environment that swung in the opposite direction, where both turnout and persuasion were factors.

Early voting, which Democratic voters embraced at the height of the pandemic, was a substantially smaller factor this year.
In Virginia, early vote totals were 42% of their 2020 totals, while overall turnout was 73% of 2020. As a result, Democrats did not bank the same early vote margin that they did a year ago. Some of these votes were eventually cast on Election Day, and McAuliffe's support on Election Day grew to 43% – compared to 37% for Democrats in 2020. As campaigners plan for 2022, it will be important to understand the changing nature of early vs. Election Day voting, especially in light of evolving pandemic conditions.

Do not take demographic data from exit polls and other Election Night surveys at face value.
We consider the exit polls to be a valuable resource, use them regularly, and appreciate the difficulty involved in publishing them on Election Night. Because of those difficulties, they must be compared to other sources and put into the context of other data. In Virginia, they show that almost the entire change from Biden to Youngkin support came from white non-college voters. We think this is inaccurate, as we don’t see any evidence of this in our or other data. Because the exits are weighted to add up to the correct result, this means estimates of other demographic groups are also unreliable.
To summarize, these results were bad for Democrats. The two top-ticket races ended up substantially worse than 2020, which was itself a close race nationally. The national environment is currently favorable for Republicans, in ways that line up with historical expectations. If Republicans stay as motivated as they were in 2021, Democratic hopes in 2022 will require both motivating our base to engage in a midterm election and convincing swing voters to cast ballots for Democratic candidates.
National Environment
This memo will provide details about the Virginia gubernatorial election, but it is important to step back and describe the national context. McAuliffe lost a close race, getting 49% of the two-way vote and losing 6 points of support compared to Biden in 2020 (a 13 point change in margin).3In this memo, we will primarily be referring to support numbers and support changes using two-way vote share, which is calculated this way: Democratic / (Democratic + Republican) votes, excluding third-party voting. Others sometimes talk in “margin” or “margin change” which functionally doubles the change in vote share. For instance, Joe Biden won Virginia 54-44 with 55% two-way support, equivalent to a D+10 margin. Terry McAuliffe lost 48-51 with 49% two-way support, equivalent to an R+3 margin. When we talk about the change from 2020-2021 then, we are showing a 6-point change in support, equivalent to a 13-point change in margin. At the same time, the New Jersey gubernatorial election was also surprisingly close, with Murphy getting 51% of the two-way vote, 7 points lower than Biden in 2020 (a 14 point change in margin).
The consistent drop from 2020 across both states is notable. The specifics of every election matter, but they all operate within the context of a larger national environment. Recent years have shown increasingly nationalized elections, where candidates rise or fall together as a function of the parties’ national brand. In 2018, for example, Democrats rode a wave of anti-Trump enthusiasm to make major gains across the country, a wave that was largely consistent across House districts, with some local variation.
Heading into this election in 2021, there were signs that the national environment was growing worse for Democrats. President Biden’s approval numbers continued to steadily decline from mid-July through the election, showing a -8 rating (43% approve, 51% disapprove) on Election Night, according to FiveThirtyEight.4As of this writing, President Biden has a net -11 approval rating, slightly worse than on Election Night 2021. While this was higher than President Trump’s -20 approval rating at the same time in 2017, it was lower than President Obama’s +9 net rating in 2009 which precipitated losses in the Virginia and New Jersey governor’s races.
Figure 1: Historical election results
Trifecta party control has generally preceded losses for the party in power in the Virginia and New Jersey Governor races, and eventually major losses in the following midterm. 2002 was an exception, perhaps as a result of 9/11.
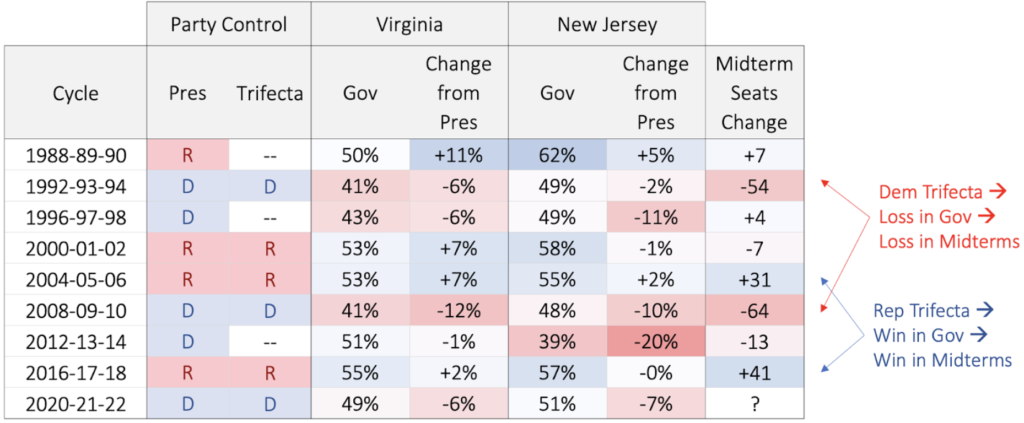
Figure 1 puts these losses in context, showing recent elections going back to 1988. The typical pattern for the party in power, particularly when that party has a federal trifecta, is losses in the following year’s gubernatorial elections in VA and NJ. When this has happened in the past, it was shortly followed by major losses in the following midterm. In 2018 and 2006, Republicans had trifecta control going into the election and lost 41 and 31 seats in the midterm, respectively. In 2010 and 1994, the opposite happened, with Democrats having trifecta control and losing 64 and 54 seats in those years. This is not a hard-and-fast rule, of course. In 2002, Republicans held trifecta control and gained 7 seats, which may have been related to significant boosts to Republican approval ratings in the wake of the September 11th attacks.
Why does this matter? As we come to grips with these election results, there is much discussion about the specifics of the Virginia race, for instance, the degree to which Youngkin was associated with Trump for different groups of voters and the salience of Republican attacks on public education. Without a doubt, these are important and could be the difference between winning and losing a close race. And at times, the distinction between local and national issues is blurry, particularly as campaigns and aligned groups seek to raise the salience of national issues at the local level. But when we see a 6-7 point swing across multiple races with varying levels of competitiveness, coverage, and spending, it is clear that the national environment is having the largest effect on election outcomes.
Turnout
Based on our analysis of precinct-level results and the Catalist voter file, the first and most noticeable trend was the incredibly high turnout for an odd-year election. 2020 showed historic high-water marks for voter turnout across the country. Even when we use that starting point as a baseline, Virginia turnout in 2021 reached 73% of 2020 levels. For context, 2017 turnout was 66% of the lower turnout 2016 election, and 2009 was 54% of the high turnout 2008 election. In comparison, New Jersey turnout rates were more in line with historical levels. If campaigns had anticipated a closer race in New Jersey, the salience of the race may have been higher for voters, increasing turnout.
Turnout by Census Tract
Figure 2 shows how that turnout breaks down across Virginia by census tract.5We use the census geocoding on the voter file to convert everything to Census geography, to (a) make results comparable over time, and (b) allow us to easily bring census data into our analysis. On the left, we see a clear partisan turnout trend. Areas that strongly supported Trump in 2020 turned out at much higher rates (75-80%) than areas that strongly supported Biden (60-70%). For comparison, the right-hand graph shows turnout in 2017, when turnout was fairly even across partisan geography despite a favorable environment for Democrats.
To be clear, turnout was still high for Democrats. It does not appear that Democrats fell to low turnout rates, at least relative to 2017. Instead, Republicans were more engaged and motivated to vote this year, at levels above and beyond what we’ve seen in this context in the past.
Figure 2: Virginia Turnout by Census Tract
(Left) Areas that supported Trump in 2020 had a very high turnout level, reaching 75-80% of 2020 levels. In contrast, Biden-supporting areas were at 60-70%.
(Right) In 2017 turnout was fairly even across partisan geography.
Demographic Characteristics of Vote Choice and Turnout
Figure 3: Virginia turnout totals by race and college education
Race and education are aggregated for voters of color to provide more reliable estimates from a larger population size. Turnout matched 2018 levels for white voters, with slightly more white college voters and slightly fewer white non-college voters. Turnout among voters of color well exceeded 2017 levels but did not quite match 2018 for all groups.
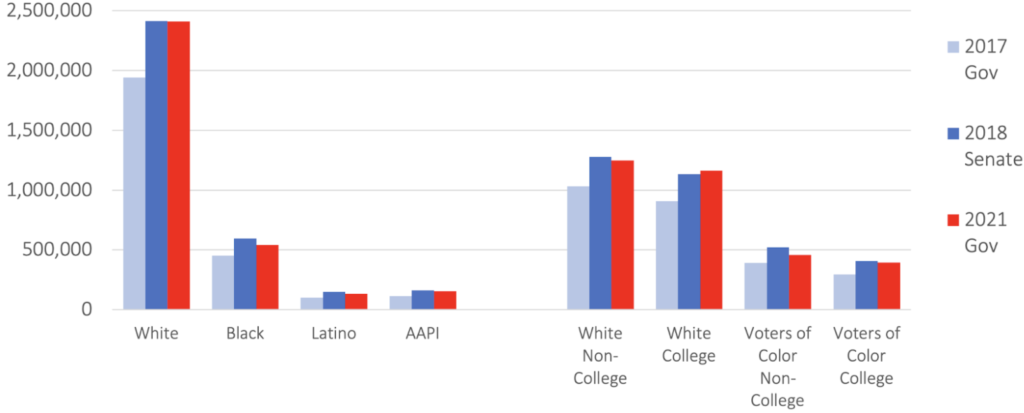
When we analyze turnout by demographic groups, we see that Republican-leaning groups had higher turnout than Democratic-leaning groups. That can be seen in Figure 3, which shows raw vote totals by race and college education status. To set the stage, 2017 had high turnout for an odd-year governor’s race (2.6m votes), but 2018 had substantially higher turnout than that (3.4m votes). In 2021, white voters matched turnout for the 2018 midterm. Black and Hispanic voters also voted at higher numbers than 2017, but did not quite reach their 2018 levels; AAPI groups essentially broke even with 2018.
Virginia has become more diverse in recent years, both in terms of population and in the composition of the electorate, but this trend essentially stopped in 2021 among gubernatorial voters. The percent of voters that were white dropped from 79% (2009) to 76% (2013) to 74% (2017), but that number appears to have held steady at 74% in 2021.
Turnout By Age Cohort
Younger voters are less likely to cast ballots in odd-year elections and Virginia’s elections in 2017 and 2021 were no exception. However, the drop-off occurred from a much higher baseline in 2021 thanks to record-breaking youth turnout in 2020. This was a significant benefit to Democrats, who have increased their vote share among younger voters over the past several election cycles. In 2020, for instance, 62% of 18-29 year-olds supported Joe Biden nationally. Increasing youth turnout — and reducing drop-off from presidential to midterm elections — will be key to Democratic success in 2022.
These trends in relative turnout are evident when we examine raw turnout numbers by birth year across these elections.
Figure 4: Raw number of votes by birth year across election cycles. 2020 and 2021 have significantly higher turnout, so while the turnout drop-off by age cohort was much smaller for older voters, younger voters comprised a greater share of the electorate in 2021 than they did in 2017.
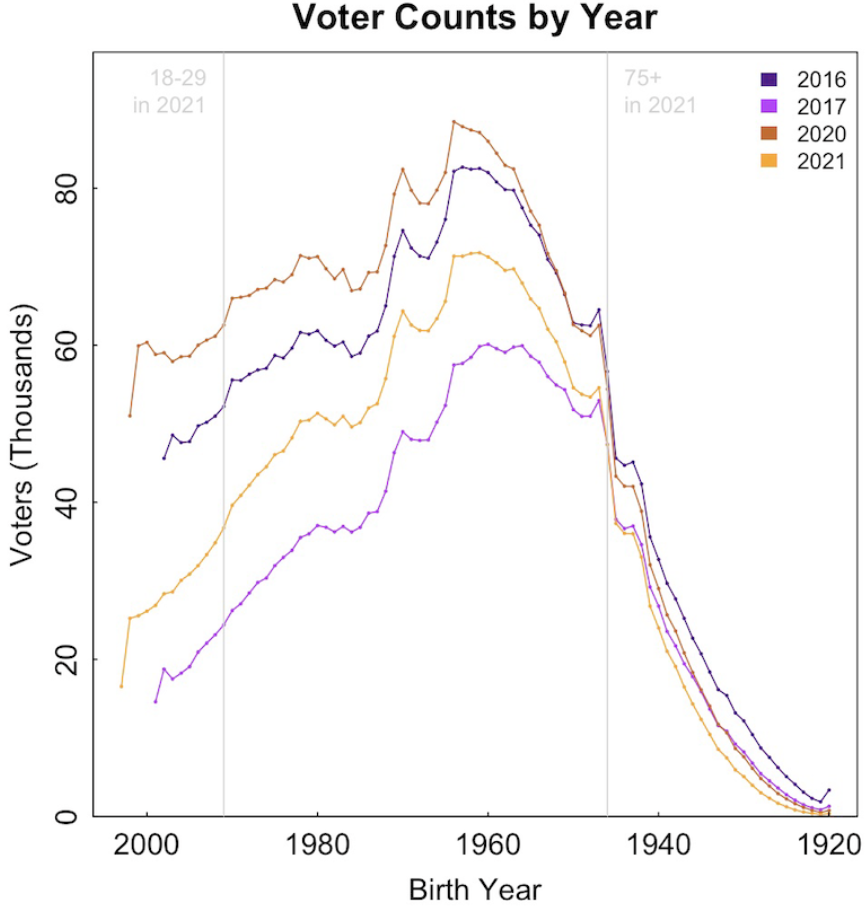
Figure 5: Turnout by birth year in the last two Virginia Gubernatorial elections. This analysis excludes voters who were too young to cast ballots in 2017. The spike in turnout among the youngest voters represents people who registered and cast ballots for the first time after 2017.
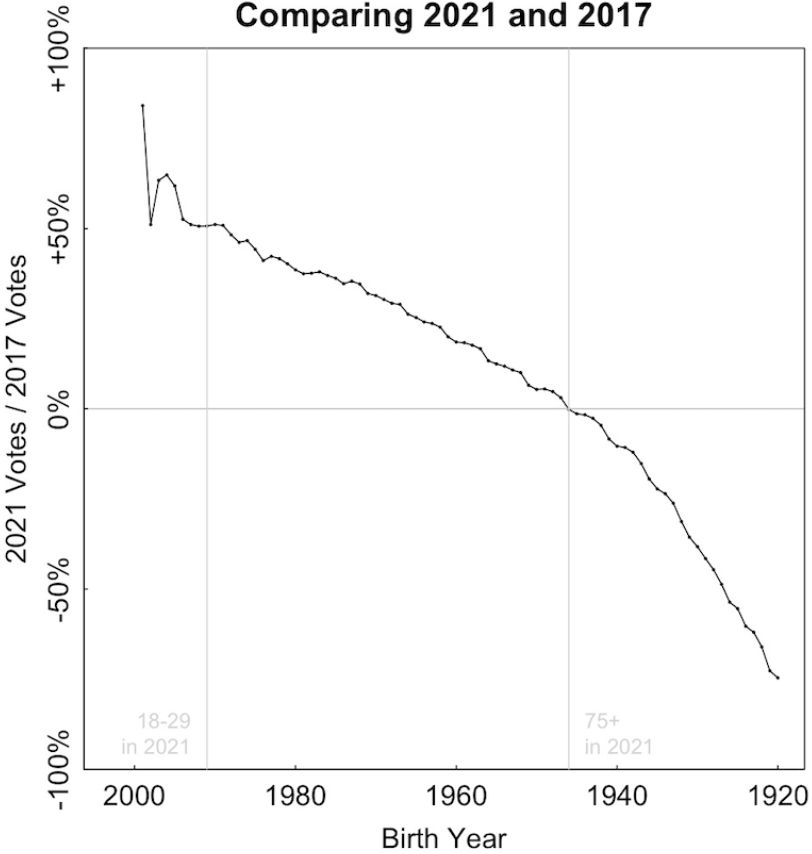
People provide their birth year to states when they register to vote, so age is a well-understood demographic factor in voting. However, analyzing the electorate by birth year is often more concrete than analysis based on generation, age ranges, or other age-based “buckets.” That’s because birth years are stable figures that can be correlated to individual voters while age naturally increases over time, meaning different people are passing in and out of different age buckets in subsequent elections. Additionally, political behaviors, including party preference, are often established in one’s early adulthood. In Figure 4, we can see that odd-year electorates are quite a bit older than Presidential year electorates, but that more raw votes were cast by younger voters across the spectrum in 2021, compared to 2017.
Using birth year rather than age groups is particularly important when core political conditions, such as turnout, change dramatically and when relatively large groups age in and out of the electorate. Younger Millennial and Gen Z voters, for instance, are casting their first ballots in relatively high turnout elections and now comprise the 18 to 29-year-old category that is often used for analyzing youth voting.6This example is based on the Pew Research Center’s definition of generational cohorts. These voters may have relatively higher turnout in subsequent elections now that they are registered, known to the parties and voter turnout groups, and have more highly developed partisan preferences. For older voters, large drop-offs in participation start to occur when age cohorts enter their early 70s, due to a combination of health problems and voters passing away. This is especially important as the leading edge of one of America’s largest age cohorts, the Baby Boomers born after World War II enters their 70s.
To compare the relative effect of these trends, we can divide the raw number of votes cast by each specific birth-year age cohort in the 2021 election by the number of votes the same birth-year age cohort cast four years earlier in 2017. This chart shows that turnout increased the most for the youngest voters and started declining for the earliest Baby Boomers, who were born in 1946. Taken together, Figure 4 and Figure 5 highlight how both odd-year electorates are consistently older than Presidential electorates but that compared to 2017, more votes came from young voters and relatively fewer for older voters.
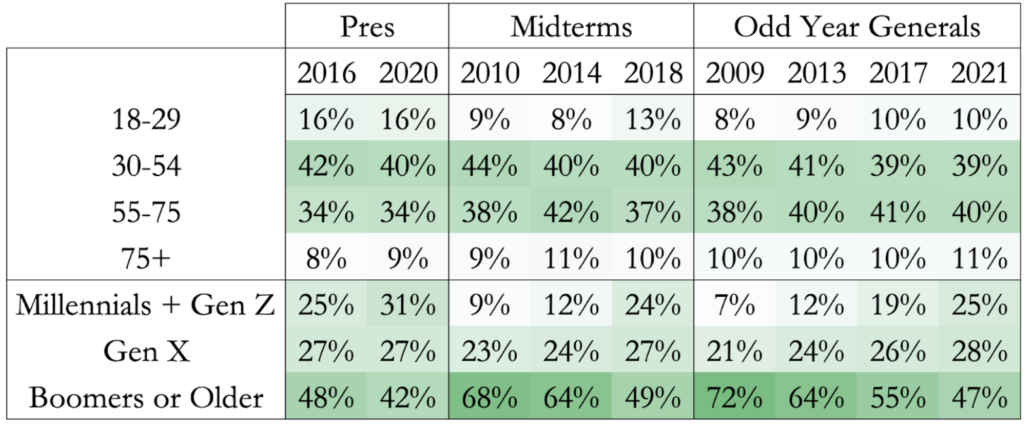
We can also take a broader view of each successive generation and how much of the electorate it comprises in specific election years and compare it to what we would see from just looking at age groupings. Looking at the data by generation we can see how the Baby Boomer share of the vote has consistently declined over the past decade-plus of elections but how that is ultimately masked by the way age groupings are reported, which show much more stability than we know to be true from the generational summaries below.
Table 1: Share of the electorate by generational age cohorts. Over time, Millennial and Gen Z voters will make up an increasing share of the electorate while the Greatest, Silent, and Baby Boomer generations will shrink. GenX voters represent a smaller cohort and came of age during relatively lower turnout elections compared to voters in the Millennial and GenZ cohorts.
Early vs. Election Day Voting
Early vote totals increased across the country in 2020 and Democratic voters drove the trend. According to our estimates, 66% of Virginia early voters supported Biden in 2020, with 64% of votes (for either candidate) cast before Election Day.
Early voting in Virginia 2021 was a different story; as we (and others) collected early vote data in the run-up to the campaign, the most notable aspect of that data was that it was lagging behind 2020 levels. By Election Day, early vote turnout was at only 42% of its 2020 levels. The question at the time was: is this due to low Democratic enthusiasm, or to Democrats shifting back to Election Day voting after receiving COVID-19 vaccines and seeing local cases drop?
Figure 6: Election Day voting bounced back in a big way in 2021, rising from 37% of votes in 2020 to 64% of votes in 2021. Monitoring these changes will be a key challenge in 2022, especially for Democrats who had disproportionately high support among early voters in 2020.
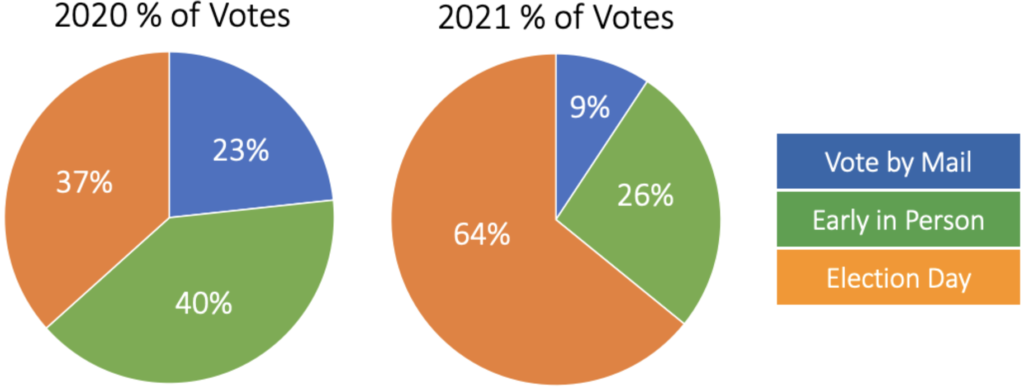
While early vote turnout was 42% of its 2020 levels, Election Day voting ended up at nearly 130% of 2020 levels. Another way of saying this is that early voting comprised 64% of votes cast in 2020, but fell to 37% in 2021. Needless to say, this is a massive change. In terms of candidate support, just 37% of Election Day voters supported Biden in 2020, up to 43% supporting McAuliffe in 2021.
This suggests that there was indeed a shift in Democratic voting patterns. At the height of the pandemic in 2020, many Democrats voted early, especially by mail. In 2021, at a time when McAuliffe lost support overall, he gained support among Election Day voters, meaning that many Democrats shifted back to Election Day voting. At the same time, it is notable that McAuliffe was not able to bank as many votes early on in the campaign.
Early voting is important, both in terms of ensuring the franchise for millions of Americans and in terms of campaign resource allocation and tactics. It is clear that the nature of early voting is rapidly changing, due to changes in laws and – just as importantly – shifting preferences and habits of voters. Understanding these changes and planning around them will be a key challenge in 2022.
Partisan Support Changes
For decades, exit polls were the fastest way to get data to pundits and analysts, to help understand the election at a time when everyone is desperately seeking information. Because of this, they are often the default, first step in understanding demographic trends in elections.
We also use and respect the exit polls. Providing data on election night is a massively difficult task, and we understand the difficulties inherent in that process. But because of those difficulties, our view is that the exit polls must be used in tandem with other data sources – such as precinct-level election results, AP VoteCast,7AP VoteCast is another survey of demographic shifts that is available on election night. It has become a competitor to the exit poll in recent years. pre-election surveys, and voter file analysis – to truly understand demographic trends in elections.
With that in mind, we have seen a substantial amount of commentary that takes the Virginia exit polls at face value. We see some problems in that data and are strongly compelled to provide another perspective given how prominently that data is used. In short, the exit polls imply that almost the entire drop in support from 2020 (Biden) to 2021 (McAuliffe) was due to white non-college voters. In the exits, white non-college voters go from 38 Biden-62 Trump (2020) to 24 McAuliffe-76 Youngkin (2021), which equals a 14-point drop in two-way support or a 28-point drop in margin. The exit polls also show a 1-point drop among white college voters, a 3-point support drop among Black voters, and a support gain of 4 and 6 points among Latino and AAPI voters, respectively.
As a clear point of comparison, AP VoteCast shows a 4-7 point drop among white college, white non-college, and Black voters, and a 16-point drop among Latino voters. Our support estimates are closer to VoteCast, showing a fairly consistent drop across demographic groups writ large.
Most convincingly, when we look at census-tract data and precinct-level returns, we do not see any evidence that the support drop was bigger in white non-college areas. If anything, the support drop looks smaller in those places, as shown in Figure 7 below. While ecological inference – translating geographic returns to individual characteristics – is difficult, we do not see evidence of massive differences in the support drop from 2020-2021 across demographic groups, with a few notable exceptions.8We combine geographic election returns with pre-election polling data. The polling data was provided by the Strategic Victory Fund and conducted by ALG Research over the course of the campaign.
Figure 7: Unlike the exit polls, geographic election returns do not imply a hugely disproportionate drop-off of Democratic support among white non-college voters. Ecological inference is difficult, but this and other data suggest this was not the story of the election.
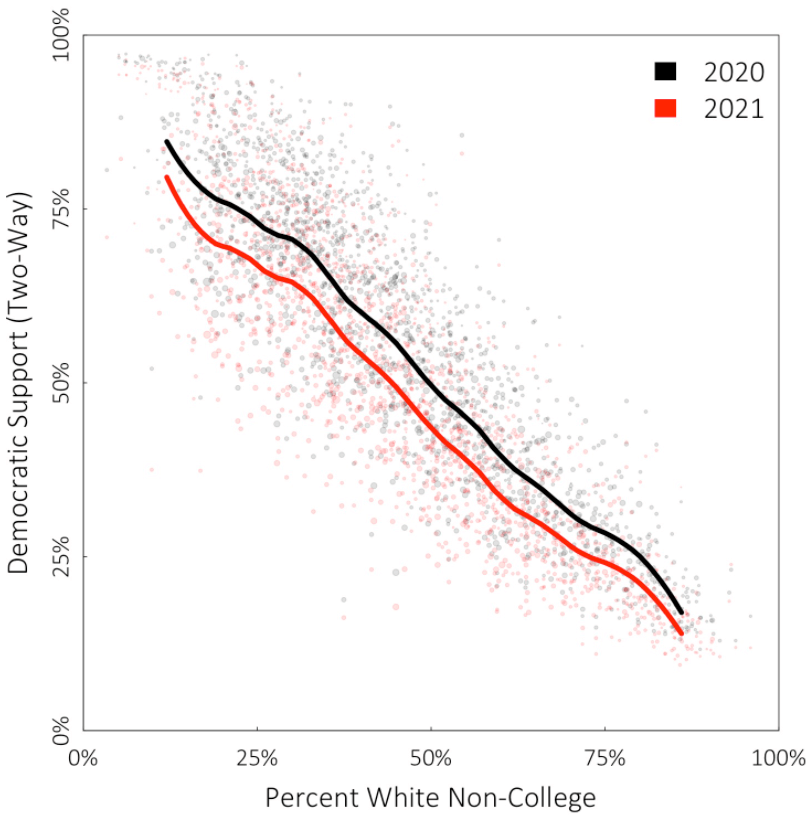
Figure 8: Geographic election returns compared to the previous presidential election. From 2020-2021, McAuliffe lost 4-6 points in most places, with a slightly higher drop in “swing neighborhoods.” 2016 (Clinton) to 2018 (Kaine Senate) was a strong Democratic environment and showed the exact opposite trend.
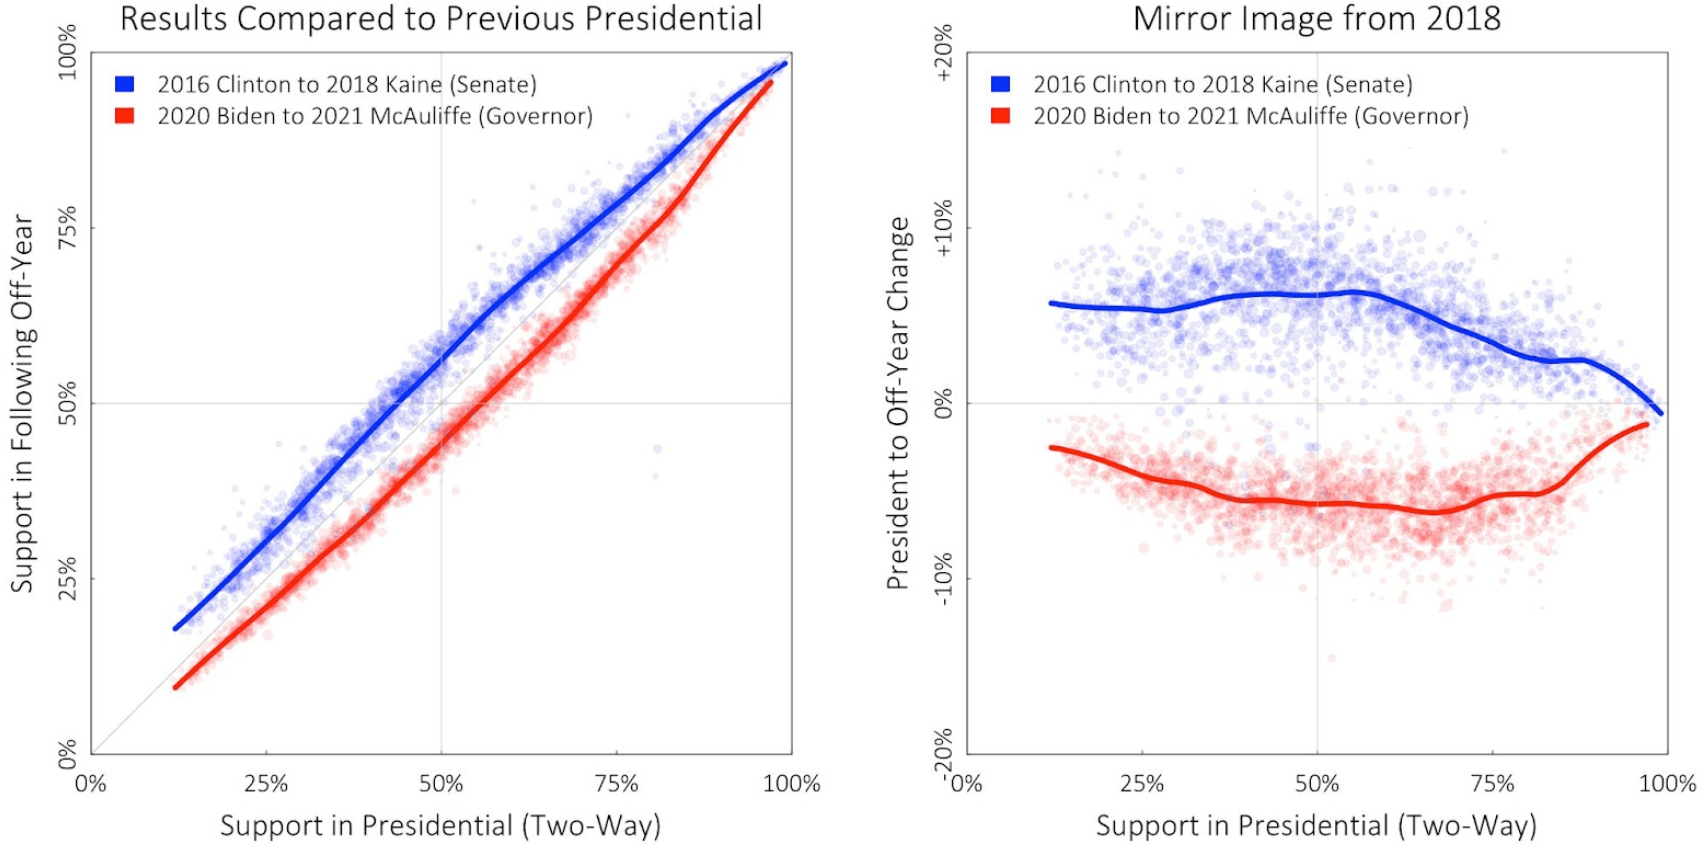
As is often the case, we see the largest drop among “middle scorers” and “swing neighborhoods,” people and areas that have not shown evidence of being particularly partisan in the past. Figure 8 shows the geographic data. The 2020-2021 shift is shown in red: with the exception of extremely Biden-supporting (usually urban) or extremely Trump-supporting (usually rural) areas, McAuliffe lost around 4-6 points everywhere. The shifts are slightly larger in the areas in the middle of the curve. While we don’t have great data available for 2017, we show the same data from 2016 (Clinton) to 2018 (Kaine Senate race) in blue, for comparison. 2018 was, of course, a very Democratic year, and the extent to which the trends mirror each other is striking.
Similar to the story above, we also see a larger drop in suburban areas (7 points) than rural (5 points) or urban areas (3 points). Lastly, we do see some evidence that McAuliffe lost more support among younger voters than older voters, though younger voters are more Democratic overall. Both of these trends are likely due to some combination of composition changes within these groups, for instance, young Democrats dropping off more than young Republicans, as well as vote switching from Biden to Youngkin voters.
Summary
The 2021 Virginia election was disappointing. Despite the historic nature of the Trump presidency, including his attempt to overturn the 2020 election results, the overall national environment appears to be moving against Democrats in ways that mirror historical trends. At least in Virginia, Republican enthusiasm was incredibly high, substantially out-pacing Democratic turnout. This, alongside fairly consistent support drops, resulted in a close loss for McAuliffe in an otherwise Democratic-leaning state.
The characteristics of midterm elections are different from odd-year governor races. They enjoy higher turnout, though not as high as presidential-year turnout. And there still is time for Democrats to change the national political context. But it is clear that the party has a lot of work to do, otherwise, we will likely face big losses in 2022.
What Happened™ Catalist © LLC. All Rights Reserved.
Proprietary data and analysis not for reproduction or republication.
Catalist’s actual providing of products and services shall be pursuant to the terms and conditions of a mutually executed Catalist Data License and Services Agreement.

