Please note: The analysis below is based on an initial estimate of the 2018 electorate. Catalist released an updated analysis of the 2018 electorate in May 2019.
January 18, 2019
Author: Zachery Crowell, Analyst
For the first time in over 20 years, Arizona elected a Democrat to the US Senate during the 2018 midterm.
The 2018 election itself was too close to call on election night, but weeks later once mail-in and provisional ballots were fully counted, Kyrsten Sinema, three term Democratic Representative of AZ-09, prevailed over Martha McSally, two term Republican from AZ-02. In the end, Sinema won by a margin of 55,900 votes, or 2.4 percentage points. In doing so, Sinema outperformed Hillary Clinton’s narrow defeat in 2016 by 6 percentage points (Clinton lost by 4 percentage points overall). Sinema also carried Maricopa County outright — a notable feat for Democrats and a key indicator of statewide competitiveness. Such a striking shift prompts one to ask: How did Sinema succeed while Clinton did not, and what does that mean for those running for Senate and President in Arizona come 2020?
We have identified four trends which highlight how Sinema broke through in 2018, and realized the potential of Arizona voting for a Democrat statewide:
- First, Sinema banked a significant number of votes in the last two weeks of early/ absentee voting.
- Second, among voters of color and Latinx voters in particular, turnout rates and support levels in 2018 were closer to presidential election levels than prior midterms like 2014.
- Third, Sinema substantially increased the Democratic margin with urban and suburban voters while moderately increasing support among white rural voters.
- Finally, she managed to persuade a significant share of 2016 third-party voters who voted in 2018.
Maximizing Support in the Early Vote
Sinema did extremely well among those who voted in the final two weeks of early/ absentee voting, as shown in the chart below (which uses modeled estimates of 2018 vote preference by ballot return date from the early vote data Catalist collected in Arizona.) Note: All ballots counted through 10/14/2018 are reflected in the left-most column.
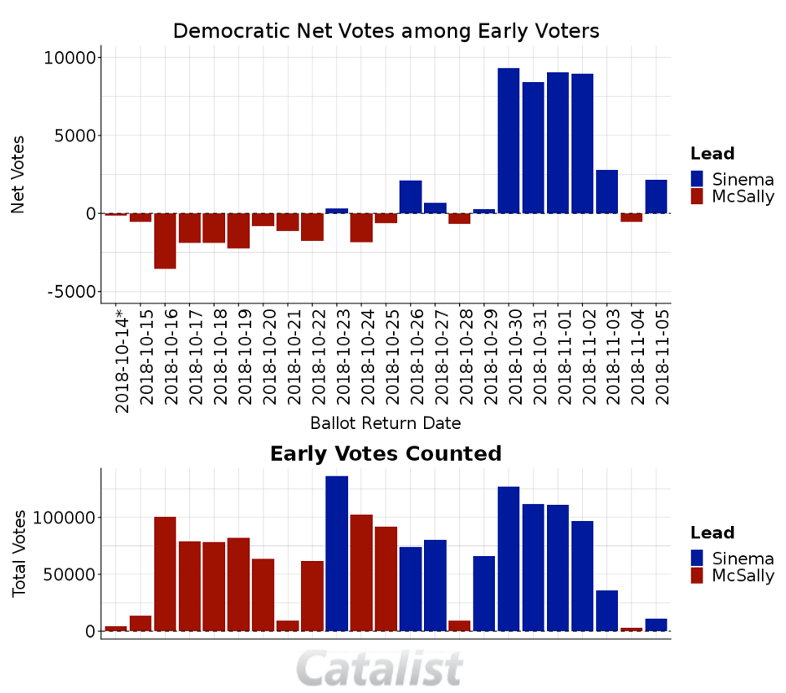
These early vote numbers, which exclude provisional ballots, work out to a net gain of 43,000 votes in the last 11 days of the election.
Retaining Support and Turnout among Voters of Color
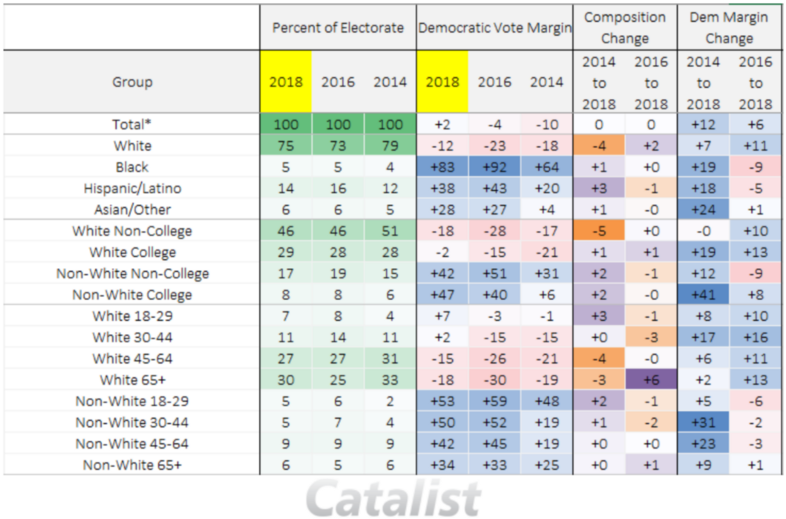
Sinema won in part by increasing support and enthusiasm among college educated voters of color and stemming the usual midterm drop in turnout among non-college voters of color. College-educated voters of color’s share of the overall electorate was on par with that of 2016 and 2 percentage points higher than 2014, while their support level grew by 8 percentage points compared to 2016 and a whopping 41 points compared to 2014. Among voters of color without college degrees (17 percent of the total electorate) the trend was similar; 2 points higher in share compared to the prior midterm, and an improvement of 12 percentage points compared to 2014 (though lower than 2016). These trends result in a common motif among the 2018 midterm elections: non-white non-college Democratic support and electoral composition were somewhere between 2014 and 2016 while non-white college Democratic support and electoral composition increased.
The margin shifts between midterms and presidential years, in large part, can be attributed to the people of color voting population being older and slightly less Democratic leaning than during presidential elections. When looking at those who voted in Arizona in both 2018 and 2016, it is clear that those modeled to be voters of color without a college degree shifted very little in their preferences. Sinema won these voters by a margin of 44 percentage points and Clinton won the same voters by a margin of 45 percentage points, for a shift of 1–2 points. Thus the majority of decline is attributed to older non-white non-college voters being both more likely to vote and vote Republican in midterm elections than their younger peers. (Note: Age breaks used in the development of the two-way support estimates shown in the graph above may produce more stark looking discontinuities between age groups.)
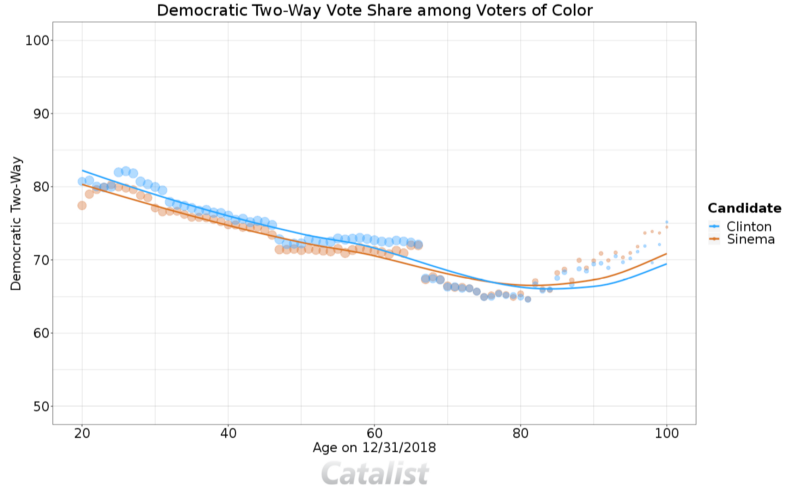
An increase in midterm voting from young voters of color appreciably boosted Democrats’ chances across the state and helped Sinema perform nearly as well as Clinton among voters of color as a whole.
Winning the Growing Suburbs
The trend which explains the largest shift leftwards is simply the suburbs became more Democratic, while rural areas showed little net movement compared to either 2016 or 2014. Maricopa County, the suburban (and overall population) hub of the state is a perfect example of Sinema’s strength compared to past candidates.
Compared to 2016, Sinema gained 7 percentage points in support among urban and suburban voters and 1 percentage point among rural voters. The figures are more dramatic using 2014 as a baseline, as Sinema gained +14 percentage points in support in the urban-suburban areas and lost 2 percentage points over the House candidates there.
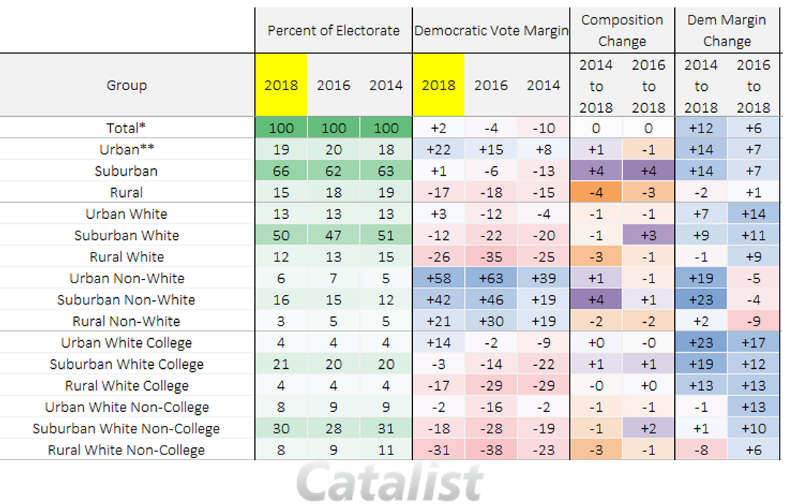
Among those who voted in both elections across Arizona, preference for the Democratic top-of-the-ticket candidates swung by a margin of 9 percentage points, namely due to urban and suburban white voters, especially those with college degrees.
A more nuanced version of how Sinema performed relative to Clinton tells a similar story: While Sinema outperformed Clinton in rural, suburban, and urban communities, the difference was most prominent in the suburbs with mid population density. In urban areas (which account for a smaller share of the vote) the difference is visible, even if not as large.
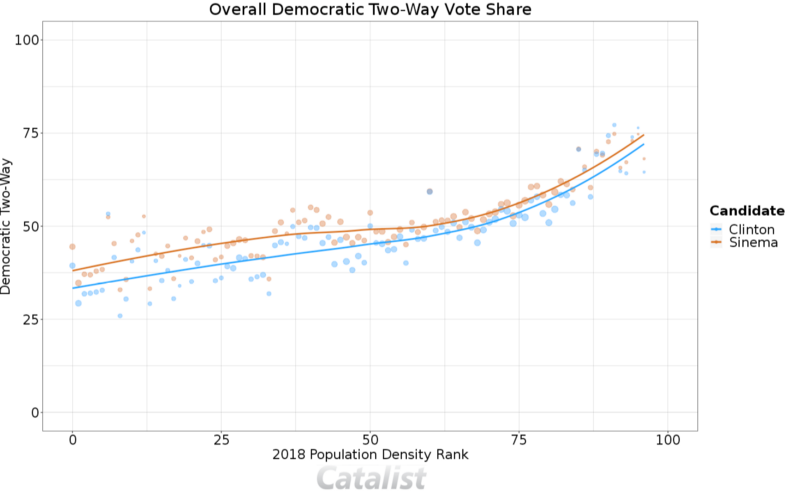
In addition to voting increasingly Democratic, the suburbs were a larger share of the vote in 2018 than any time since 2008, due to a combination of population growth and differential turnout:

Furthermore, we can find clear geographic patterns at the Census tract-level. (Note: As some areas of Arizona are quite rural and sparsely populated, some of the Census tracts mapped above may have very few residents. This is an important consideration when comparing patterns over time.)
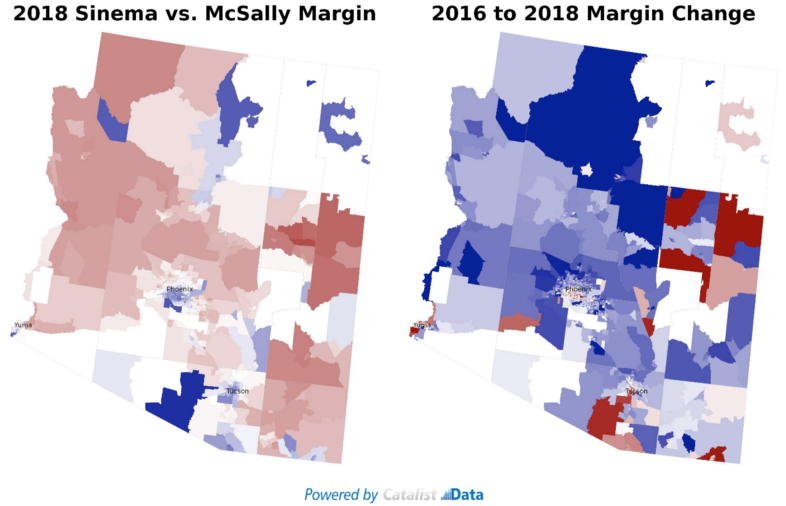
It is clear from the maps above that much of the pattern in urbanity can be meaningfully divided by race. Specifically, Sinema modestly underperformed Clinton’s margin in majority non-white regardless of population density. Meanwhile Sinema overperformed Clinton’s margin in majority white areas nearly everywhere, but especially so in the urban and suburban areas of the state.1The margin and margin change estimates in areas with fewest votes per census tract will also have the largest variances in estimates, relative to other areas.
Third Party Consolidation
At the topline level, and accounting for all ballots cast (not just 2-way vote share), Sinema (50 percent support) performed 6 percentage points better than Clinton (44 percent support) while McSally (48 percent support) received the same vote share as Trump (48 percent support). However, this figure does not distinguish between vote switching and differential turnout.
When we explicitly estimate the net amount of vote switching, Sinema managed to gain 20,000 more votes from voters who switched from casting a third party vote in 2016 to casting a vote for one of the two major party candidates. Catalist estimates that Sinema won 58% of those who crossed over from 2016 and possibly the majority of those who voted in 2018.
Much of this shift can be observed in the crosstabs below. For example, while white voters under the age of 30 provided an 8 percentage point gain in Republican performance between 2016 and 2018, the group increased their Democratic performance by 18 percentage points , a net swing of 10 percentage points (52 percent support Sinema in 2018 vs. 34 percent who support Clinton in 2016). Furthermore, third party votes cast by this group declined from 29% to 2%. In an election that came down to the narrowest vote tally, every gain — even when among small numbers of voters — can make a difference in the overall outcome.

Thank to Michael Frias.

