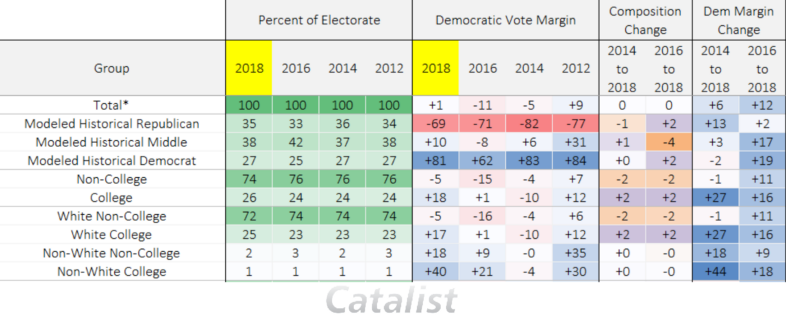
These trends also hold true when examining the intersection of race and education (although the district is almost 97% white). Our estimates suggest Golden did even better among white college-educated voters than Clinton did, by a 16 percentage point increase in margin, and improved by 11 percentage points in margin among white voters without a college degree, though still falling short by 10 points compared to Obama’s 2012 level of support with that group.
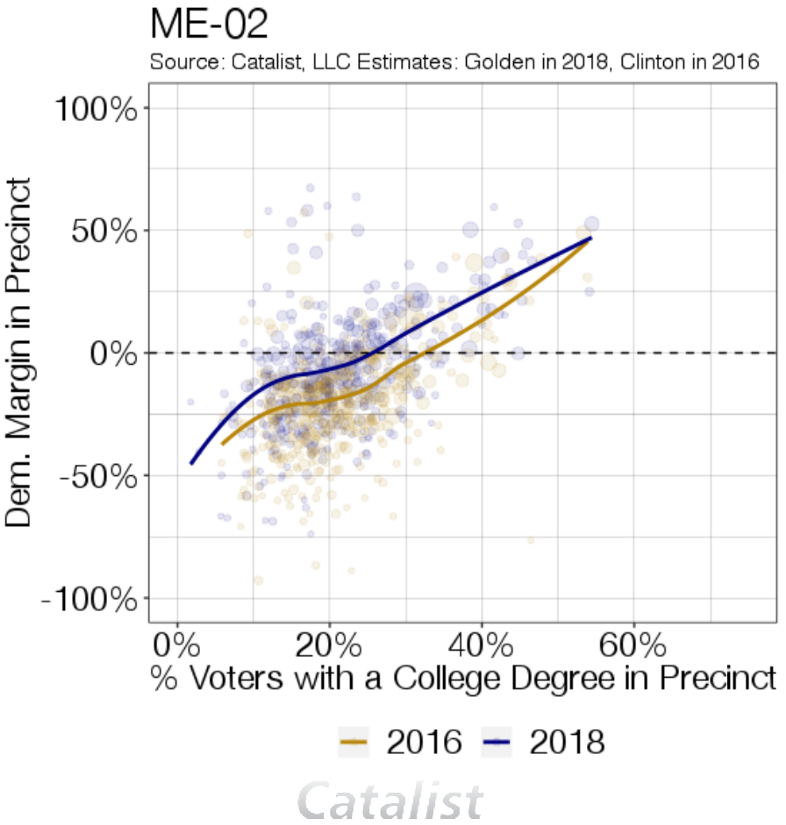
This trend is further illustrated when looking at precinct level performance, as shown in the chart below. Though Golden overperformed Clinton in the handful of highly educated areas of the district, he most notably surpassed her level of support in the areas of the district with average education levels, if not the less well-educated parts of the district.1With the exceptions being the extreme points at either end of the spectrum, where Golden essentially replicated Clinton’s performance.
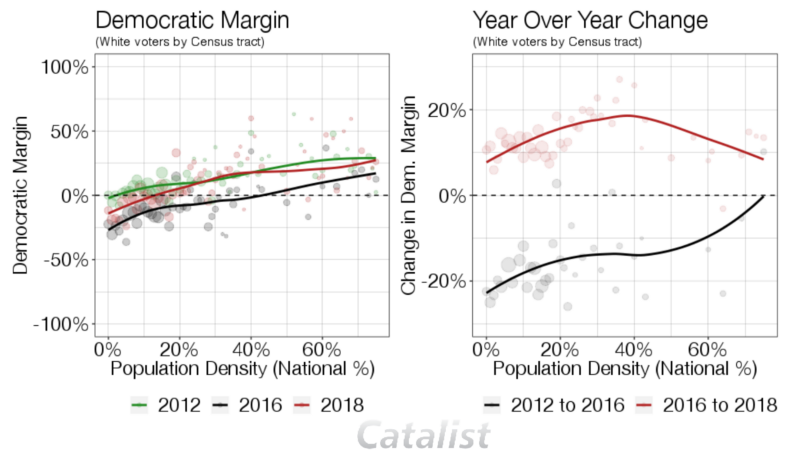
The urban-suburban-rural divide in politics (along with the education level of a particular area) grew more polarized in 2016, and comparing those trends to what we observe in 2018 in ME-02 can tell an important story about how political trends changed in this district in 2018. In the figure below, we plot Catalist’s support estimates among white voters aggregated by Census tract against population density.2Nationally, as we can see that most of the district falls below the 20th percentile of density, making it quite rural according to out metrics, around 85% rural in our categorization.
In the plot below, on the left, we can see another illustration of the trends that have changed over time in this district. For example, in 2012, Obama broke even in terms of vote margin, on average, in every precinct in the district. That was not the case for Clinton in 2016, where she broke even in the district, on average, in Census tracts that were only slightly above the national average in terms of population density. However, in 2018, Golden got over 50% of the vote, on average, in Census tracts that were extremely rural (in the bottom 15 percent of census tract density nationally), performing much better than Clinton did in the sparsely populated parts of the district. This is in line with the education numbers we presented above, and show that Democrats are still underwater with rural voters, but much less so than in the past. These patterns are reflected in the graph on the right side of the plot below. 2016 represented a large underperformance compared to 2012, illustrated by the black line that is in the bottom (negative) portion of the graph, however, there is less underperformance in the denser areas of the district to the right. In 2018, this same pattern persisted with less underperformance in the denser areas of the district, but with a much higher overall level of Democratic performance overall.
Golden won despite a more characteristically “midterm” environment, whereas most other parts of the country showed electorates more similar to presidential election years
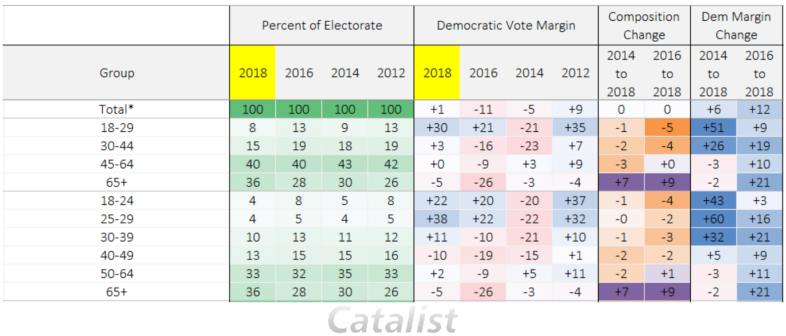
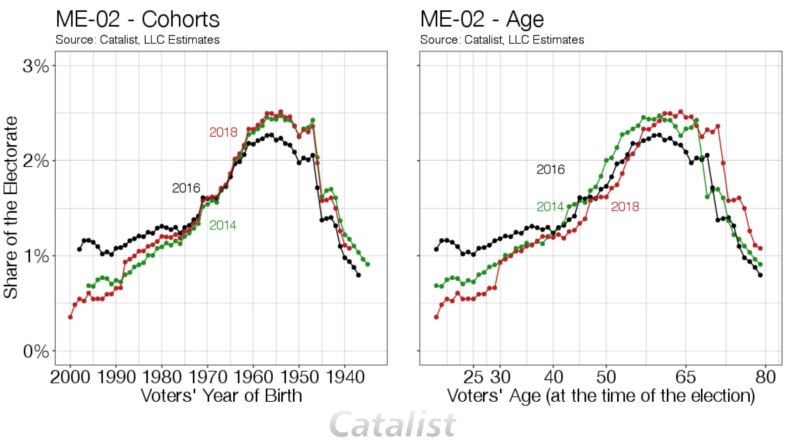
According to Catalist estimates, the electorate in ME-02 was slightly older than it was in 2014, despite it being moderately more favorable in partisan turnout compared to 2014 (and a wash compared to 2016). The trends we see in voter turnout related to age compare strongly with what my colleagues observed in North Dakota and other older, less diverse states. As was the case in that state, in 2018, ME-02’s electorate was the oldest seen going back to at least 2006.3These numbers (as in North Dakota) are less striking when looking at the median or average age than at standard age groupings. These changes have more to do with the midterm environment interacting with an aging baby-boomer cohort that is starting to cross the threshold between the 50–64 and 65+ categories. This is consistent with other data that is less well appreciated, showing an increasingly aging citizen population, which will likely be even older when examining the voting population.
When we look at the plots below we can see that trends in voter turnout related to your generational cohort show more predictable trends and patterns, but when we change at age at the time of the election as opposed to birth year, we can see the clear evidence that the electorate, in just four years, has indeed gotten older and will continue to do so for quite some time due to the big influence of the baby boomer generation.
In ME-02, voter turnout looked more similar to past midterms than it did to a presidential election when it came to voter turnout, diverging with what we have observed in other states Catalist has profiled, as well as nationally. In part, this has to do with the fact that voter turnout, at least in demographic terms is much more stable in this district across years than it is in other parts of the country.
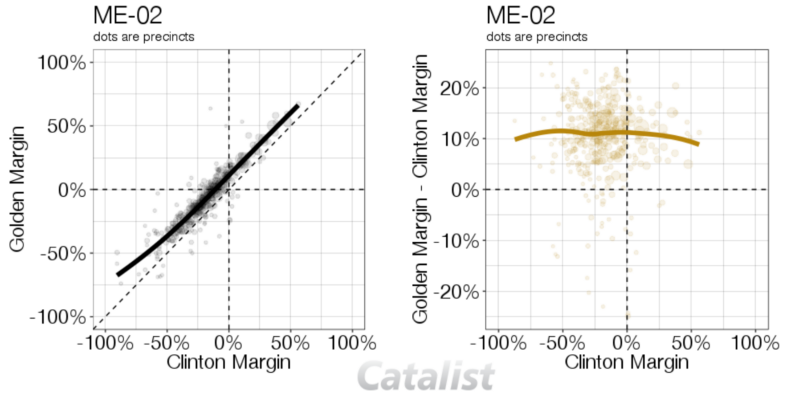
Golden ran ahead of Clinton evenly from the coast all the way inland, as opposed to running up the score only in particular areas
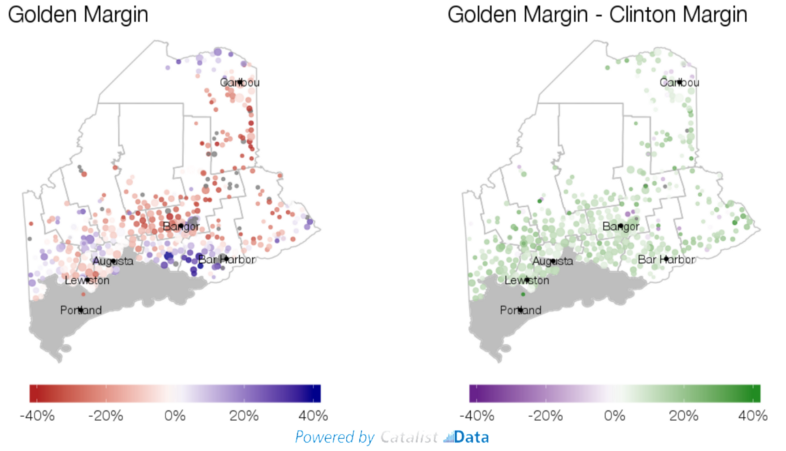
Examining the data from a geographic as opposed to a demographic lens, we see Golden outperforming Clinton’s vote share across the board — including in rural, suburban, and urban areas, and inland as well as on the coasts. This is different from what we saw in a race like the Georgia Governor’s race where Democrat Stacy Abrams did considerably better in “swingy” precincts and underperformed in Republican areas.
We can see the partisan dynamics of the district at play in the map below as well. In what is a well-known fact to followers of Maine politics, the coastal portions of the district and areas surrounding the larger towns in the district are more reliably Democratic than the further inland and rural parts of the district. However, as we saw in the plot above, overperformance was relatively uniform (with, as always, a few small outliers).
