Please note: The analysis below is based on an initial estimate of the 2018 electorate. Catalist released an updated analysis of the 2018 electorate in May 2019.
February 15, 2019
Author: Jonathan Robinson, Lead Research Scientist
Just 1,315 votes separated Democrat Dan Feehan from victory over Republican Jim Hagedorn, making it one of 2018’s closest House races and a rare example of defeat in an election that was so favorable for Democrats across the country. The seat, which had been represented by now-Governor Tim Walz since 2006, has had a contentious partisan record in national elections — Obama won the district by narrow margins in 2008 and 2012, yet it swung almost 15 points in margin towards Donald Trump in 2016. Some observers even wondered if a Democrat could even run a competitive race in this largely rural, working-class seat moving forward. How did Feehan come so close to winning? And what can we learn from a district that didn’t go the way Democrats hoped it would have?
- Turnout in partisan terms resembled recent Presidential electorates, meaning the composition of the electorate was much less Republican compared to the past two midterm elections in 2014 and 2010.
- Similar to other Obama-Trump districts we have profiled, Feehan improved over Hillary Clinton’s performance across the board, but mostly by making up ground with Democratic and Independent-leaning voters — while only losing a small amount of ground among Republican voters.
- Feehan made stronger gains among college-educated voters in the district than those without a degree, who still make up a large majority of voters. Younger voters in this district, especially the generation of voters who were first eligible election to vote in 2016, are much more Republican here than nationally or other geographies we have profiled.
Consistent with national trends, turnout in the district was more favorable to Democrats than it had been in previous midterms
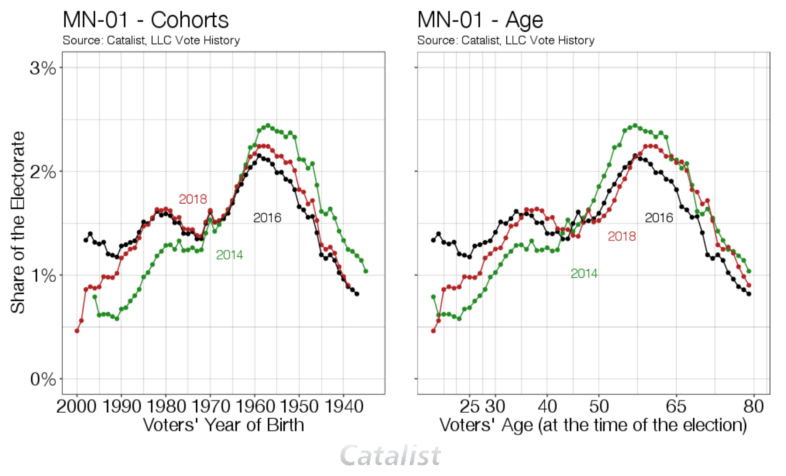
As will be obvious to readers of our series, a constant theme of the 2018 electorate was that it was more favorable than previous midterms when it came to turnout among Democrats and important parts of the Democratic coalition, like younger voters and communities of color. In a district that is around 95% white, we can focus on turnout among young voters to gauge how well the trends we’ve observed in our previous analyses compare to what happened in MN-01. In the graphs below, we plot the share of the electorate that belongs to each birth year cohort (in the left graph) and age group at the time of the election (in the right graph). Older cohorts of voters were a smaller portion than in past midterm elections but the electorate was not quite as young as the 2016 presidential election. On top of that, we see again that despite relative consistency in how cohorts turned out, the electorate has been getting older as the large Baby Boom generation reaches retirement. This produces an electorate that despite being only moderately younger than the 2016 presidential electorate is just as old as the 2014 electorate in some respects.1This is not the case when looking at average or median age, but is when looking at the share of the electorate over 65 years of age.

One thing that was encouraging in this district (as well as nationally) was that despite demographic turnout not exactly matching 2016, in partisan terms the 2018 electorate in MN-01 nearly matched 2016’s turnout in compositional terms. Compared to the 2014 midterms, 2018 looks to have been better for Democrats, with the Republican share of voter turnout falling four percentage points, made up for mostly by Independent leaning voters who swung to the Democrats. This is consistent with national trends that found that modeled Democratic voters didn’t increase their vote share as much as the Republican share of voters fell.

As has been true with many Obama-Trump geographies we have examined, persuasion is responsible for much of the differences in the outcome in 2018, but this is especially true in MN-01, where high overall turnout levels mean less variability in the partisan composition of the electorate than what we have seen nationally and in other geographies with more variable turnout. The swing in the vote from 2012 to 2016 by partisanship helps to illustrate the difficult political environment in the district going into the 2018 elections. In 2016, Clinton’s vote margin among Democrats was only 39 points, 40 points less than Obama’s in 2012, and only improved by 7 points among Republicans compared to 2012.
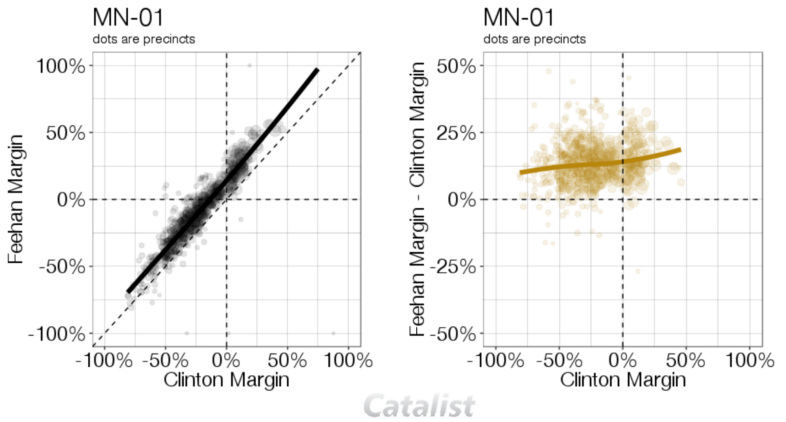
Feehan overperformed Clinton pretty much equally across the district, but performing slightly better on average in more Democratic areas and slightly worse on average in more Republican ones hurt his chances
As will become apparent here, and will be familiar to analysts examining districts on either side of narrow victories, despite losing the race, Feehan’s impressively-close showing exhibits a great deal of similarity with other Midwestern Obama-Trump races. Feehan overperformed Clinton nearly uniformly across the district. As in other districts, there were a significant number of precincts that Clinton lost in 2016, and in those precincts, Feehan performed slightly worse than he did in the precincts that Clinton won in 2016. This slight difference, not what we saw in similar seats like ME-02, meant that Feehan’s performing generally better everywhere alone wasn’t enough to overcome underperforming (relatively speaking) in Republican-leaning areas. By doing slightly better in the Democratic areas of the district (as defined by 2016 Clinton margin) than in the Republican areas of the districts ultimately cost him precious votes, in part because the Republican-leaning areas make up a bigger share of the district.

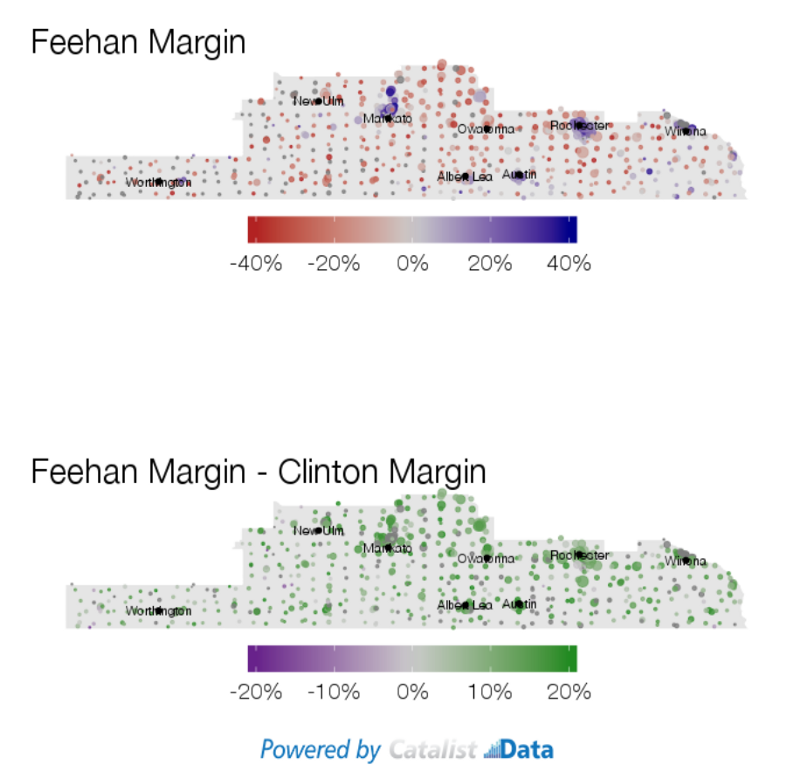
This is more apparent in a map of the district below, where we can see his overperformance in the better educated more suburban areas of the district (like the town of Rochester — home of the Mayo Clinic), was higher than it was in the more Republican, less well educated rural areas of the district.

The structure of Feehan’s coalition strongly adhered to Clinton’s, but weaker performance among voters without a college degree and young voters can help explain falling just shy of victory
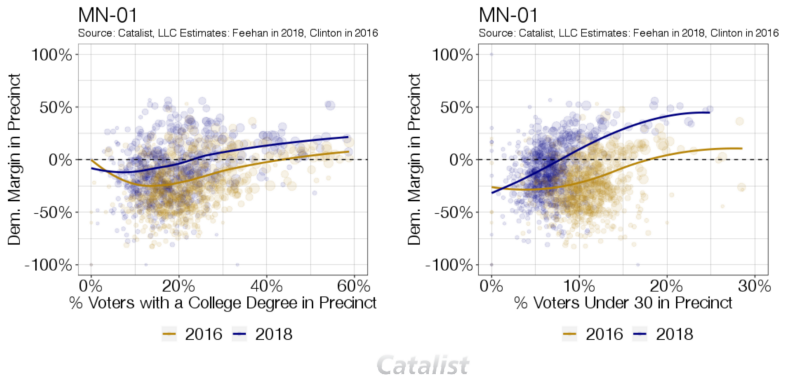
Beyond looking at geography, we can trace different support trends back to specific demographic groups. As was apparent in the map above, when compared to 2016, we can see that Feehan overperformed with college-educated voters in comparison to those without a degree, who still make up nearly 70% of the electorate. In this demographic, we can also see that the current education based coalitions that exist in this district naturally advantage Republican candidates. Using Walz’s performance in the district in 2014 as a point of comparison shows how it is easier to run up big victories by doing better among white voters without a college degree in this district.2In fact, Feehan also performed 24 percentage points in margin worse than Walz did with white voters without a college degree, but 21 only percentage points better with white voters with a college degree.

Interestingly we can also see a flavor of a trend we have observed in our national and other district analyses. The youngest cohort of voters, aged 18–24, are indeed more Republican than the slightly older cohorts. We see this in our national data where we estimate that 18–24 year olds favored Democrats by a margin of 38 points, but that 25–29 year olds favored Democrats by an even bigger margin of 51 percentage points! The national numbers are not nearly as dramatic as they are in MN-01. In fact, our data suggest that 18–24 year olds favored Democrats by only a margin of 6 percentage points and voted for Trump by a margin of 5 points in 2016. Some of this has to do with differing demographics when comparing national data to voters in MN-01, but these numbers are low even when compared to other districts like ME-02 or MI-08. To illustrate, 18–24 year olds increased their margin for Feehan by 10 percentage points over Clinton, but support in the 25–29 year old cohort increased by 20 points, twice that of the slightly younger cohort.

We can see these trends with respect to both of these demographic groups in the raw precinct results. Precincts that were more educated overperformed much more than precincts that are less educated, and similarly with age, we can see that in 2016, younger voters were not nearly as supportive of Democrats in 2016 as they were in 2018.


