Please note: The analysis below is based on an initial estimate of the 2018 electorate. Catalist released an updated analysis of the 2018 electorate in May 2019.
January 18, 2019
Author: David Margolis, Deputy Director of Analytics
In 2018, Minnesota had 10,000 lakes, two senate elections, one gubernatorial contest, and five of eight congressional races that were considered competitive. Over recent decades, the home of Hubert Humphrey, Walter Mondale, and Paul Wellstone has been the focus of Republican efforts to make gains in rural areas and in the suburbs of Minneapolis-St. Paul, with the hope of turning this progressive bulwark into a purple state. After years in which Democrats came perilously close to losing Minnesota to George W. Bush (winning by 2.4 percentage points in 2000 and 3.5 percentage points in 2004), Barack Obama won by a strong 11 percentage point margin in 2008, though by less in 2012 (8 percentage points). However, while many focused only on the “Blue Wall” states that Donald Trump won in 2016, his close margin in Minnesota (losing by roughly 1.5 percentage points) has led many to believe Republicans have turned Minnesota into a battleground state in 2020.1Cook Political Report currently rates Minnesota as “Lean Democratic” in 2020.[/1] This is the backdrop for our analysis of the 2018 results, which will focus on two of those elections: Senator Amy Klobuchar’s successful re-election and Representative Tim Walz’s successful campaign to succeed fellow Democrat Mark Dayton as governor of Minnesota. In this post, we examine three features of the Democratic successes in these statewide campaigns: High turnout boosted Democratic candidates According to Michael McDonald’s Election Project, Minnesota was the state with the highest turnout rate among voting eligible people in 2018, continuing a persistent pattern of being among the states with highest voter turnout rates. There are many reasons for this, including accommodating voting registration laws such as same-day and online registration, but those are subjects for a different analysis. It suffices to note that the 2,596,879 votes cast for the midterm Senate race were 88% of the total votes cast for president in 2016. In comparison, the total national turnout in 2018 was 83% of 2016. In the case of 2018, high turnout resulted in an electorate that was more favorable for Democrats than prior midterm cycles. In 2018, that meant the electorate was less Republican, more diverse, and younger. And among the white voters who turned out, a greater proportion of them were college-educated. Compared to 2014, and as shown in the chart below, modeled Democrats maintained a consistent share of the electorate (30 percent of all votes cast), while Republicans’ share declined by 4 percentage points to 21 percent.2There is no party registration in Minnesota so partisan designations refer to estimates of historic voting patterns, modeling Democrats, Republicans, and Middle partisans — those who may have shifted or split partisan leanings or may just be more difficult to classify.
Those voters in the historical middle (i.e., those more likely to be independents) surged in participation — 49 percent of all votes cast in 2018 vs. just 45 percent in 2014.

Further, Minnesota’s electorate in 2018 was considerably younger than in 2014. Voters under the age of 40 accounted for 23 percent of the electorate in 2014, while they were 4 points higher in 2018.
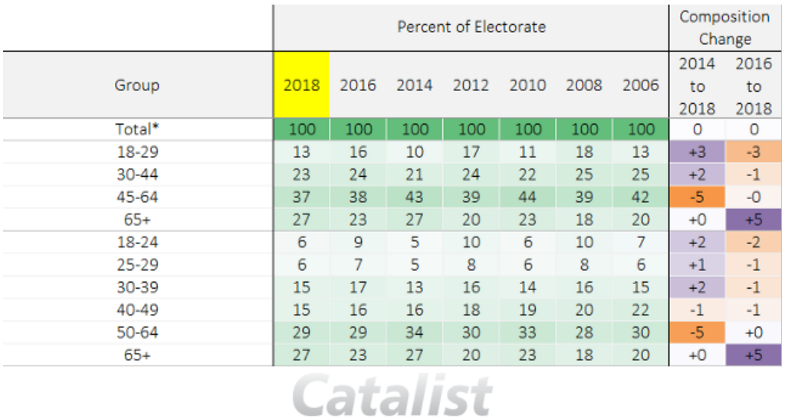
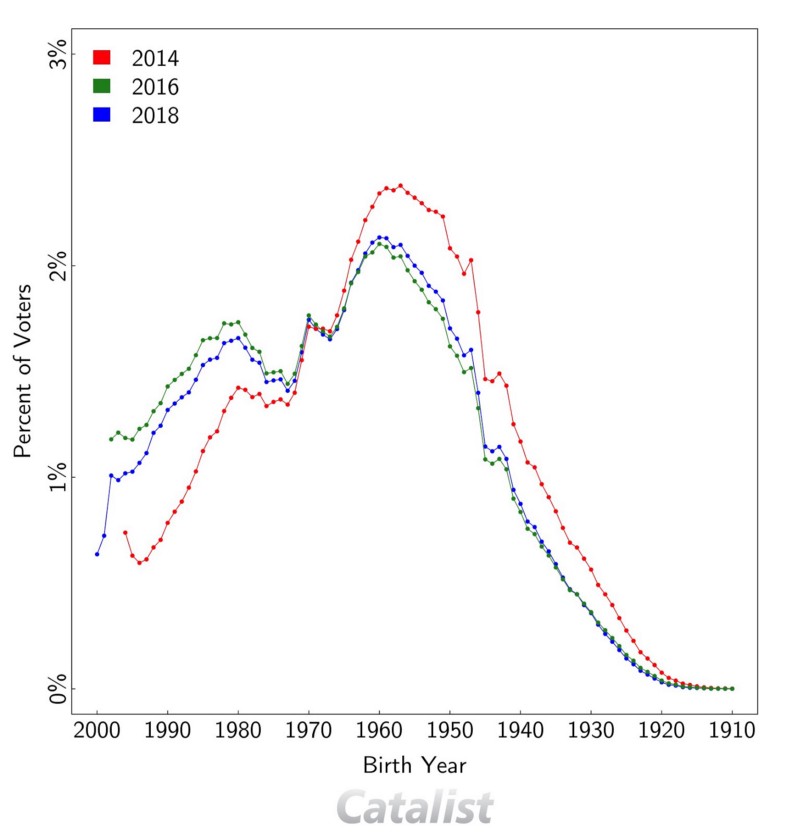
As the figure below further illustrates, the age distribution of the electorate was more similar to the presidential election of 2016 than it was to the 2014 midterm, again, despite the aging of the Baby Boom generation into the 65+ age range.
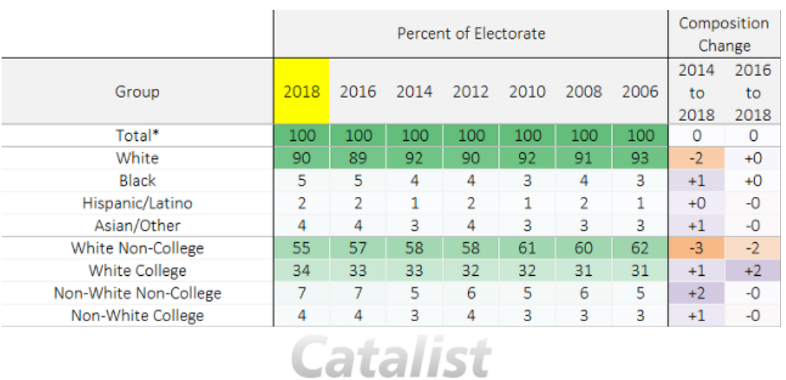
The electorate was also marginally more diverse than it was in 2014, with the white share dropping from 92% to 90%. Considering that the proportion of the electorate that was white and college educated grew by a point, most of this decline came from lower turnout among non-college educated whites.
Higher Support with Middle Partisans and White College Educated Women
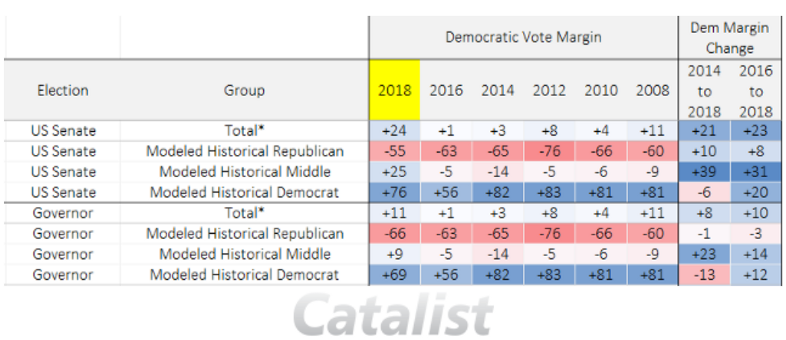
The modeled historical middle swung decisively towards Democratic candidates in 2018 compared to 2014 and 2016, with Representative Walz winning them by 9 percentage points and Senator Klobuchar winning them by 25 percentage points. Respectively, these were 14 point and 31 point swings compared to Clinton’s performance among these voters in 2016.
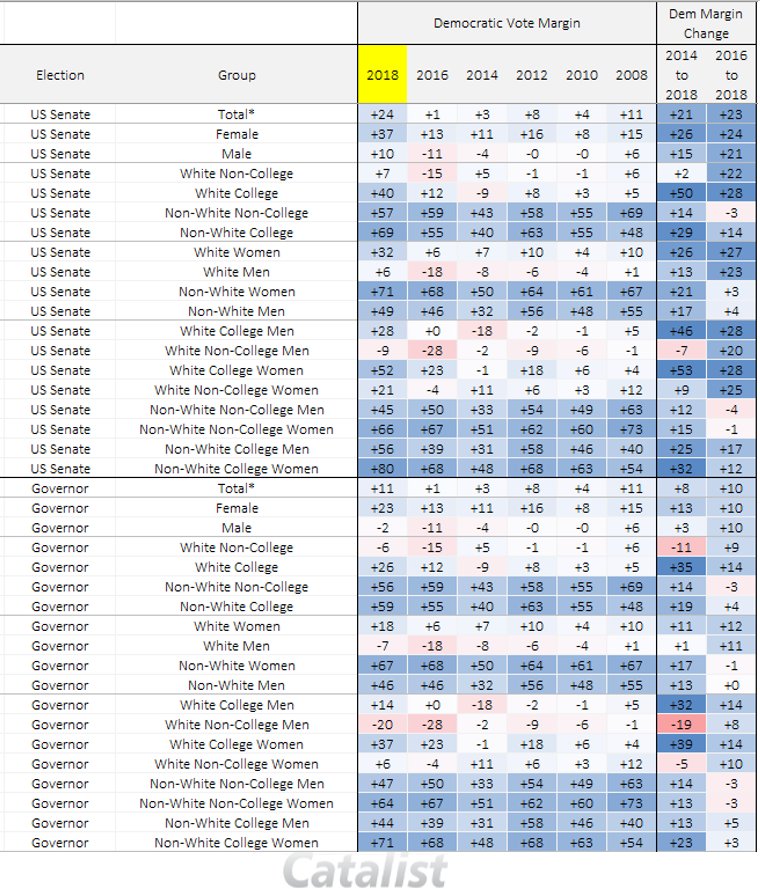
Both candidates in 2018 performed very strongly with white college educated women, even relative to Clinton’s commanding 23 point lead over Trump in 2016. Senator Klobuchar won this group by 52 points, even more than Representative Walz. But Senator Klobuchar also improved substantially over Clinton’s margin among white college men — a 28 point difference, whereas Representative Walz only improved by 14 points.
Much stronger Democratic performance across suburban and rural Minnesota
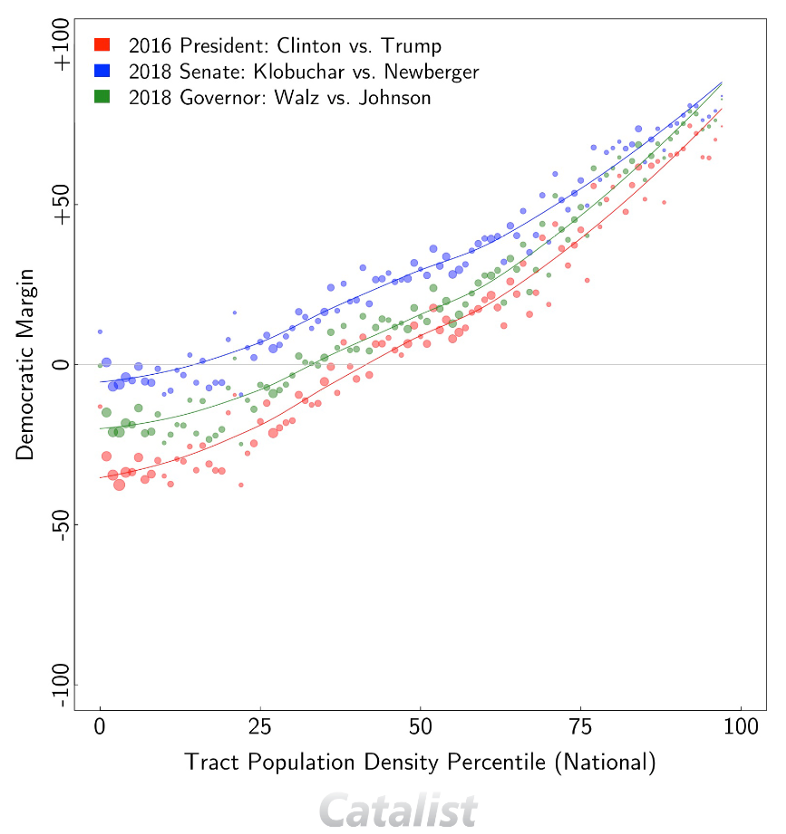
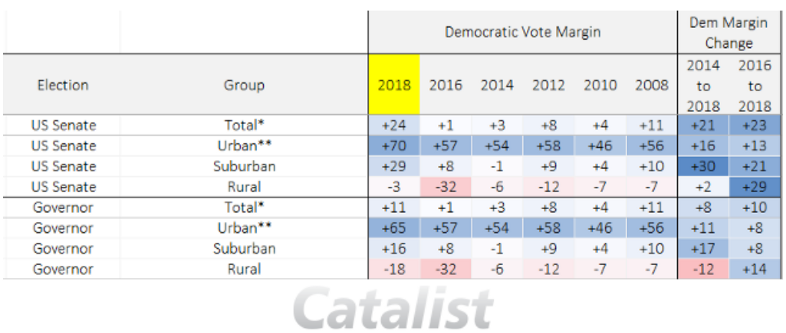
Much of the commentary about 2018, especially in the Midwestern states, has focused on a perceived growing divide between reddening rural areas and bright blue urban communities. As Yair Ghitza outlines in an earlier post, this perception is being driven by a focus on districts that switched from one party’s control to the other, which is to say, even small margin shifts from 51 percent to 49 percent rather than the absolute size of the shifts in margins. A case in point is Minnesota, where Democrats lost two congressional seats in rural parts of the state, leading to a perception that Democrats lost ground in the farmland near Iowa and the Iron Range.3More on this when Catalist Analytics turns to a stand alone analysis of MN-01.
In fact, both Senator Klobuchar and Representative Walz improved Democratic performance by large margins in rural Minnesota and by similar amounts improved their margins in suburban Minnesota. If anything, their improvements in urban Minnesota were more modest than their gains relative to Secretary Clinton in 2016. These trends are illustrated in the graphs below.
